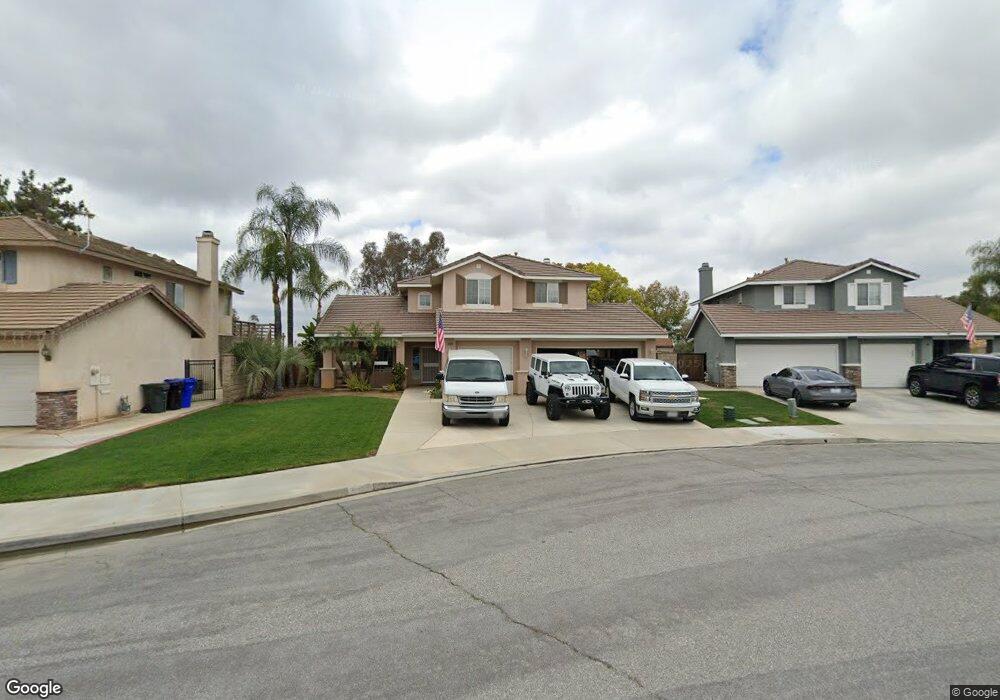
33308 Golden Meadow Ct Yucaipa, CA 92399
Estimated Value: $642,516 - $730,000
5
Beds
3
Baths
2,389
Sq Ft
$282/Sq Ft
Est. Value
About This Home
This home is located at 33308 Golden Meadow Ct, Yucaipa, CA 92399 and is currently estimated at $674,879, approximately $282 per square foot. 33308 Golden Meadow Ct is a home located in San Bernardino County with nearby schools including Dunlap Elementary, Park View Middle School, and Yucaipa High School.
Ownership History
Date
Name
Owned For
Owner Type
Purchase Details
Closed on
Nov 11, 2016
Sold by
Wagner James A
Bought by
Wagner James A and Wagner Janice L
Current Estimated Value
Purchase Details
Closed on
Apr 4, 2007
Sold by
Wagner James A
Bought by
Newman Sam C and Newman Joyce H
Purchase Details
Closed on
Apr 29, 2002
Sold by
Johnson Benjamin O
Bought by
Wagner James A and Wagner Janice L
Home Financials for this Owner
Home Financials are based on the most recent Mortgage that was taken out on this home.
Original Mortgage
$199,200
Interest Rate
6.94%
Purchase Details
Closed on
Jul 10, 1998
Sold by
Inland West Partners Ii Lp
Bought by
Johnson Benjamin Q and Johnson Jolene
Home Financials for this Owner
Home Financials are based on the most recent Mortgage that was taken out on this home.
Original Mortgage
$140,000
Interest Rate
6.9%
Purchase Details
Closed on
Oct 16, 1997
Sold by
Inland West Partners Ii Lp
Bought by
Inland West Partners Ii Lp
Create a Home Valuation Report for This Property
The Home Valuation Report is an in-depth analysis detailing your home's value as well as a comparison with similar homes in the area
Home Values in the Area
Average Home Value in this Area
Purchase History
| Date | Buyer | Sale Price | Title Company |
|---|---|---|---|
| Wagner James A | -- | None Available | |
| Newman Sam C | -- | None Available | |
| Wagner James A | $249,000 | Commonwealth Land Title Insu | |
| Johnson Benjamin Q | $180,000 | Fidelity National Title | |
| Inland West Partners Ii Lp | -- | Fidelity National Title |
Source: Public Records
Mortgage History
| Date | Status | Borrower | Loan Amount |
|---|---|---|---|
| Previous Owner | Wagner James A | $199,200 | |
| Previous Owner | Johnson Benjamin Q | $140,000 |
Source: Public Records
Tax History Compared to Growth
Tax History
| Year | Tax Paid | Tax Assessment Tax Assessment Total Assessment is a certain percentage of the fair market value that is determined by local assessors to be the total taxable value of land and additions on the property. | Land | Improvement |
|---|---|---|---|---|
| 2025 | $4,416 | $367,848 | $91,962 | $275,886 |
| 2024 | $4,416 | $360,635 | $90,159 | $270,476 |
| 2023 | $4,386 | $353,564 | $88,391 | $265,173 |
| 2022 | $4,581 | $346,632 | $86,658 | $259,974 |
| 2021 | $4,504 | $339,835 | $84,959 | $254,876 |
| 2020 | $4,535 | $336,351 | $84,088 | $252,263 |
| 2019 | $4,419 | $329,756 | $82,439 | $247,317 |
| 2018 | $4,318 | $323,291 | $80,823 | $242,468 |
| 2017 | $4,224 | $316,952 | $79,238 | $237,714 |
| 2016 | $4,167 | $310,737 | $77,684 | $233,053 |
| 2015 | $4,124 | $306,069 | $76,517 | $229,552 |
| 2014 | $4,118 | $300,073 | $75,018 | $225,055 |
Source: Public Records
Map
Nearby Homes
- 33467 Washington Dr
- 33155 Avenue D
- 33540 Washington Dr
- 12510 8th St
- 12422 Stardell Ln
- 12630 12th St
- 92399 Yucaipa Blvd
- 12984 Columbia Ave
- 33353 Wallace Way
- 12419 13th St
- 11967 Southwind Way
- 12813 7th St Unit 26
- 36551 Avenue E
- 33600 Calimesa Blvd Unit 37
- 33600 Calimesa Blvd Unit 141
- 32568 Kentucky St
- 12798 6th St
- 12435 14th St
- 12915 14th St
- 12830 6th St Unit 15
- 33314 Golden Meadow Ct
- 33320 Golden Meadow Ct
- 33337 Golden Meadow Ct
- 33328 Golden Meadow Ct
- 33345 Golden Meadow Ct
- 33306 Rosemond St
- 33340 Golden Meadow Ct
- 33314 Rosemond St
- 33357 Golden Meadow Ct
- 33326 Rosemond St
- 33352 Golden Meadow Ct
- 12646 10th St
- 33334 Rosemond St
- 33366 Golden Meadow Ct
- 33371 Golden Meadow Ct
- 33309 Rosemond St
- 33271 Washington Dr
- 33348 Rosemond St
- 33374 Golden Meadow Ct
- 33400 Bodie St