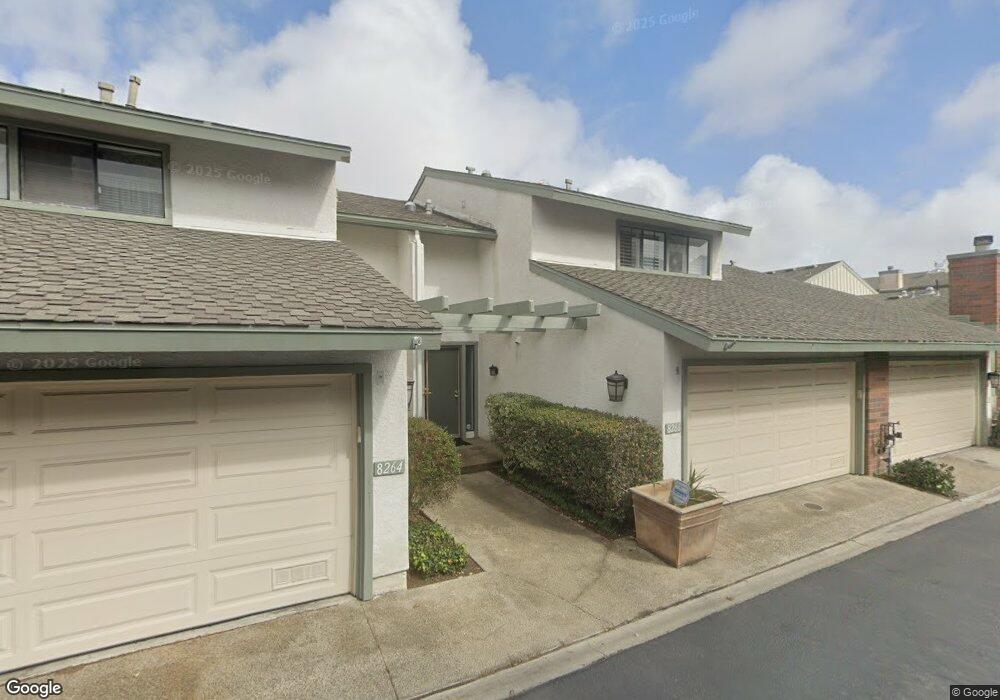
3335 Caminito Vasto Unit 347 La Jolla, CA 92037
La Jolla Village NeighborhoodEstimated Value: $1,032,475 - $1,098,000
3
Beds
3
Baths
1,416
Sq Ft
$748/Sq Ft
Est. Value
About This Home
This home is located at 3335 Caminito Vasto Unit 347, La Jolla, CA 92037 and is currently estimated at $1,059,369, approximately $748 per square foot. 3335 Caminito Vasto Unit 347 is a home located in San Diego County with nearby schools including Torrey Pines Elementary School, Muirlands Middle School, and La Jolla High School.
Ownership History
Date
Name
Owned For
Owner Type
Purchase Details
Closed on
Jan 9, 2006
Sold by
Greenlee Terrill Lee and Greenlee Zoe Ann Kathleen
Bought by
Greenlee Terrill Lee and Greenlee Zoe Ann Kathleen
Current Estimated Value
Purchase Details
Closed on
Jun 5, 1998
Sold by
Greenlee Terrill Lee and Greenlee Zoe Ann Kathleen
Bought by
Greenlee Terrill Lee and Greenlee Zoe Ann Kathleen
Home Financials for this Owner
Home Financials are based on the most recent Mortgage that was taken out on this home.
Original Mortgage
$146,000
Outstanding Balance
$29,157
Interest Rate
7.03%
Mortgage Type
Purchase Money Mortgage
Estimated Equity
$1,030,212
Purchase Details
Closed on
Jul 3, 1995
Sold by
Lehner Charles F and Lehner Ellen A
Bought by
Greenlee Terrill Lee and Greenlee Zoe Ann Kathleen
Purchase Details
Closed on
Mar 10, 1994
Sold by
Greenlee Terrill Lee and Greenlee Zoe Ann Kathleen
Bought by
Lehner Charles F and Lehner Ellen A
Home Financials for this Owner
Home Financials are based on the most recent Mortgage that was taken out on this home.
Original Mortgage
$78,000
Interest Rate
6.74%
Mortgage Type
Purchase Money Mortgage
Create a Home Valuation Report for This Property
The Home Valuation Report is an in-depth analysis detailing your home's value as well as a comparison with similar homes in the area
Home Values in the Area
Average Home Value in this Area
Purchase History
| Date | Buyer | Sale Price | Title Company |
|---|---|---|---|
| Greenlee Terrill Lee | -- | -- | |
| Greenlee Terrill Lee | $74,000 | United Title Company | |
| Greenlee Terrill Lee | -- | -- | |
| Lehner Charles F | -- | Chicago Title Company |
Source: Public Records
Mortgage History
| Date | Status | Borrower | Loan Amount |
|---|---|---|---|
| Open | Greenlee Terrill Lee | $146,000 | |
| Closed | Lehner Charles F | $78,000 |
Source: Public Records
Tax History Compared to Growth
Tax History
| Year | Tax Paid | Tax Assessment Tax Assessment Total Assessment is a certain percentage of the fair market value that is determined by local assessors to be the total taxable value of land and additions on the property. | Land | Improvement |
|---|---|---|---|---|
| 2025 | $3,106 | $255,347 | $119,761 | $135,586 |
| 2024 | $3,106 | $250,341 | $117,413 | $132,928 |
| 2023 | $3,038 | $245,433 | $115,111 | $130,322 |
| 2022 | $2,957 | $240,621 | $112,854 | $127,767 |
| 2021 | $2,937 | $235,904 | $110,642 | $125,262 |
| 2020 | $2,902 | $233,486 | $109,508 | $123,978 |
| 2019 | $2,850 | $228,909 | $107,361 | $121,548 |
| 2018 | $2,666 | $224,421 | $105,256 | $119,165 |
| 2017 | $2,603 | $220,022 | $103,193 | $116,829 |
| 2016 | $2,561 | $215,709 | $101,170 | $114,539 |
| 2015 | $2,524 | $212,470 | $99,651 | $112,819 |
| 2014 | $2,485 | $208,309 | $97,699 | $110,610 |
Source: Public Records
Map
Nearby Homes
- 8280 Caminito Sonoma
- 3252 Via Marin Unit 9
- 8127 Caminito Mallorca
- 4085 Rosenda Ct Unit 259
- 8340 Via Sonoma Unit F
- 8370 Via Sonoma Unit F
- 8037 Caminito Mallorca
- 3275 Caminito Eastbluff Unit 203
- 3304 Caminito Eastbluff Unit 143
- 3264 Caminito Eastbluff Unit 106
- 3244 Caminito Eastbluff Unit 44
- 3935 Caminito Silvela
- 2712 Angell Ave
- 3167 Via Alicante Unit 242
- 3161 Via Alicante Unit 132
- 7901 Avenida Kirjah
- 3238 Via Alicante
- 3430 Via Alicante
- 3136 Via Alicante Unit G
- 8585 Via Mallorca Unit 32
- 8250 Caminito Modena
- 8258 Caminito Modena
- 8248 Caminito Modena
- 8246 Caminito Modena
- 8238 Caminito Modena
- 8232 Caminito Modena
- 8230 Caminito Modena
- 8220 Caminito Modena
- 8214 Caminito Modena
- 8212 Caminito Modena
- 3350 Caminito Gandara
- 3342 Caminito Gandara
- 3334 Caminito Gandara
- 3326 Caminito Gandara
- 3312 Caminito Vasto
- 3304 Caminito Vasto
- 3325 Caminito Vasto
- 8272 Caminito Modena
- 8268 Caminito Modena
- 8266 Caminito Modena