Estimated Value: $240,000 - $284,299
2
Beds
2
Baths
1,478
Sq Ft
$171/Sq Ft
Est. Value
About This Home
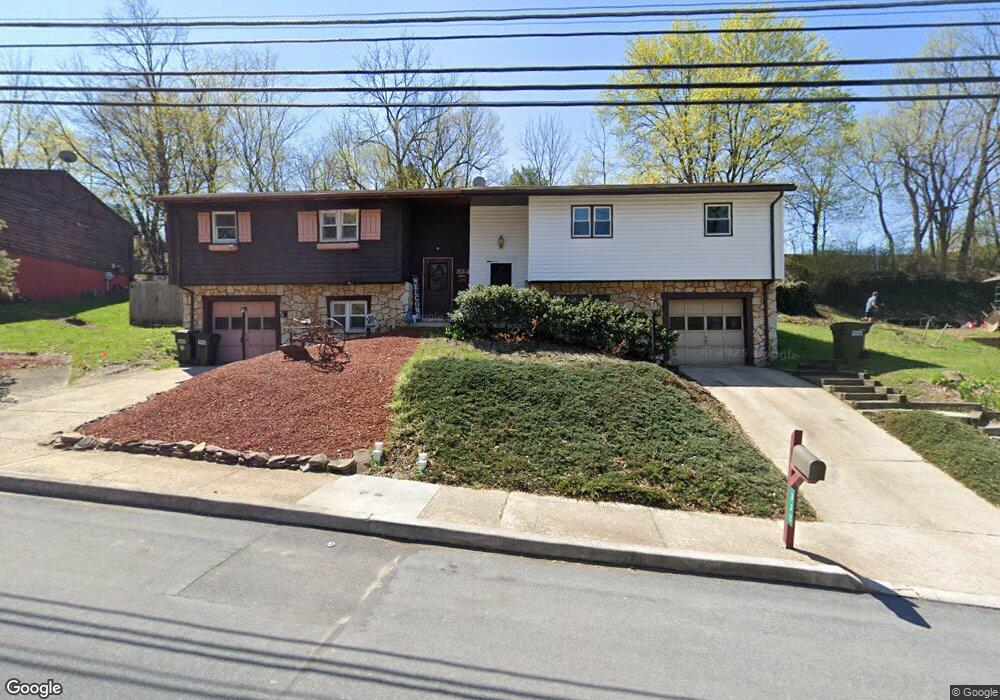
This home is located at 334 Fulton St, Akron, PA 17501 and is currently estimated at $252,825, approximately $171 per square foot. 334 Fulton St is a home located in Lancaster County with nearby schools including Akron Elementary School, Ephrata Intermediate School, and Ephrata Senior High School.
Ownership History
Date
Name
Owned For
Owner Type
Purchase Details
Closed on
Feb 17, 2021
Sold by
Royer Shelly L
Bought by
Royer Shelly L and Ansel Dakota James
Current Estimated Value
Home Financials for this Owner
Home Financials are based on the most recent Mortgage that was taken out on this home.
Original Mortgage
$109,995
Outstanding Balance
$98,293
Interest Rate
2.65%
Mortgage Type
New Conventional
Estimated Equity
$154,532
Purchase Details
Closed on
Oct 4, 2011
Sold by
Kruise Edward J and Kruise Frances T
Bought by
Royer Shelly L
Home Financials for this Owner
Home Financials are based on the most recent Mortgage that was taken out on this home.
Original Mortgage
$106,476
Interest Rate
4.2%
Mortgage Type
New Conventional
Create a Home Valuation Report for This Property
The Home Valuation Report is an in-depth analysis detailing your home's value as well as a comparison with similar homes in the area
Home Values in the Area
Average Home Value in this Area
Purchase History
| Date | Buyer | Sale Price | Title Company |
|---|---|---|---|
| Royer Shelly L | -- | Riverbend Settlement Sln | |
| Royer Shelly L | $100,000 | None Available |
Source: Public Records
Mortgage History
| Date | Status | Borrower | Loan Amount |
|---|---|---|---|
| Open | Royer Shelly L | $109,995 | |
| Closed | Royer Shelly L | $106,476 |
Source: Public Records
Tax History Compared to Growth
Tax History
| Year | Tax Paid | Tax Assessment Tax Assessment Total Assessment is a certain percentage of the fair market value that is determined by local assessors to be the total taxable value of land and additions on the property. | Land | Improvement |
|---|---|---|---|---|
| 2025 | $3,216 | $128,500 | $39,100 | $89,400 |
| 2024 | $3,216 | $128,500 | $39,100 | $89,400 |
| 2023 | $3,102 | $128,500 | $39,100 | $89,400 |
| 2022 | $3,037 | $128,500 | $39,100 | $89,400 |
| 2021 | $2,976 | $128,500 | $39,100 | $89,400 |
| 2020 | $2,976 | $128,500 | $39,100 | $89,400 |
| 2019 | $2,938 | $128,500 | $39,100 | $89,400 |
| 2018 | $3,366 | $128,500 | $39,100 | $89,400 |
| 2017 | $2,817 | $104,600 | $34,400 | $70,200 |
| 2016 | $2,817 | $104,600 | $34,400 | $70,200 |
| 2015 | $678 | $104,600 | $34,400 | $70,200 |
| 2014 | $1,923 | $104,600 | $34,400 | $70,200 |
Source: Public Records
Map
Nearby Homes