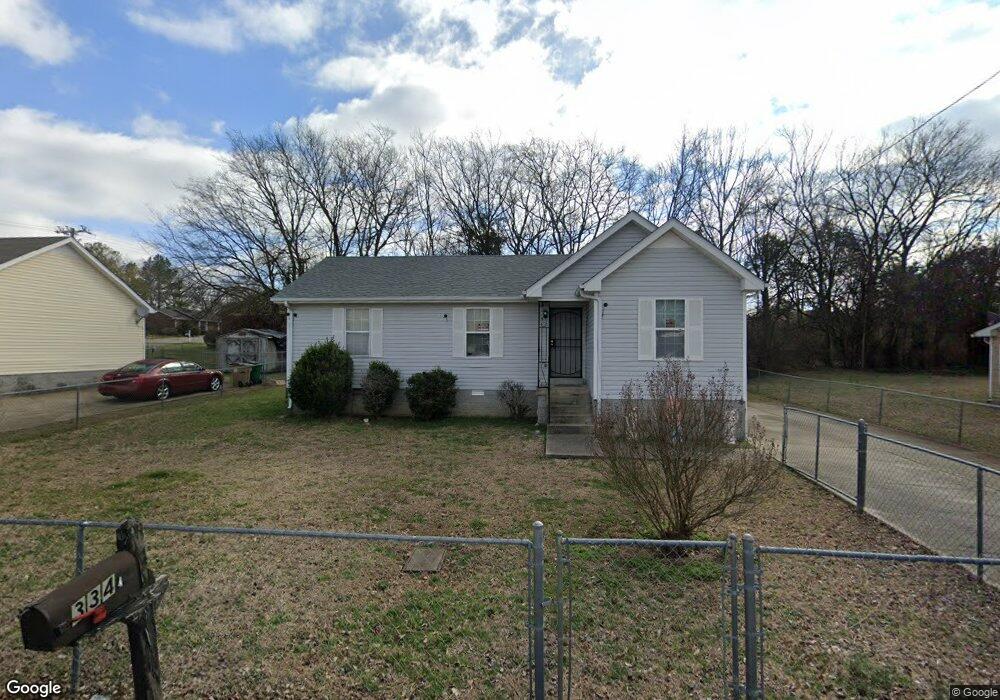
3342 Moorewood Dr Nashville, TN 37207
Bellshire Terrace NeighborhoodEstimated Value: $248,000 - $290,000
3
Beds
2
Baths
1,104
Sq Ft
$244/Sq Ft
Est. Value
About This Home
This home is located at 3342 Moorewood Dr, Nashville, TN 37207 and is currently estimated at $268,852, approximately $243 per square foot. 3342 Moorewood Dr is a home located in Davidson County with nearby schools including Bellshire Elementary Design Center, Madison Middle Prep, and Hunters Lane Comprehensive High School.
Ownership History
Date
Name
Owned For
Owner Type
Purchase Details
Closed on
Nov 23, 2009
Sold by
Pte Development Llc
Bought by
Bond Donna M
Current Estimated Value
Home Financials for this Owner
Home Financials are based on the most recent Mortgage that was taken out on this home.
Original Mortgage
$79,237
Outstanding Balance
$51,686
Interest Rate
4.98%
Estimated Equity
$217,166
Purchase Details
Closed on
Jul 31, 2009
Sold by
Greco Jeraldine B
Bought by
Pte Development Llc
Home Financials for this Owner
Home Financials are based on the most recent Mortgage that was taken out on this home.
Original Mortgage
$56,650
Interest Rate
5.37%
Mortgage Type
Unknown
Purchase Details
Closed on
May 23, 2002
Sold by
Thomas Roderick A and Thomas Iris N
Bought by
Hud
Purchase Details
Closed on
Oct 3, 1997
Bought by
Thomas Roderick A
Home Financials for this Owner
Home Financials are based on the most recent Mortgage that was taken out on this home.
Original Mortgage
$76,278
Interest Rate
7.55%
Mortgage Type
FHA
Create a Home Valuation Report for This Property
The Home Valuation Report is an in-depth analysis detailing your home's value as well as a comparison with similar homes in the area
Home Values in the Area
Average Home Value in this Area
Purchase History
| Date | Buyer | Sale Price | Title Company |
|---|---|---|---|
| Bond Donna M | $80,700 | None Available | |
| Pte Development Llc | $47,693 | Advantage Title & Escrow | |
| Hud | $85,127 | -- | |
| Thomas Roderick A | $78,000 | -- | |
| Thomas Roderick A | $78,000 | Southeast Title Tennessee In | |
| Universal Builders Llc | -- | Southeast Title |
Source: Public Records
Mortgage History
| Date | Status | Borrower | Loan Amount |
|---|---|---|---|
| Open | Bond Donna M | $79,237 | |
| Previous Owner | Pte Development Llc | $56,650 | |
| Previous Owner | Thomas Roderick A | $76,278 |
Source: Public Records
Tax History Compared to Growth
Tax History
| Year | Tax Paid | Tax Assessment Tax Assessment Total Assessment is a certain percentage of the fair market value that is determined by local assessors to be the total taxable value of land and additions on the property. | Land | Improvement |
|---|---|---|---|---|
| 2024 | $1,358 | $41,725 | $14,250 | $27,475 |
| 2023 | $1,358 | $41,725 | $14,250 | $27,475 |
| 2022 | $1,358 | $41,725 | $14,250 | $27,475 |
| 2021 | $1,372 | $41,725 | $14,250 | $27,475 |
| 2020 | $1,064 | $28,100 | $6,250 | $21,850 |
| 2019 | $774 | $28,100 | $6,250 | $21,850 |
| 2018 | $774 | $28,100 | $6,250 | $21,850 |
| 2017 | $774 | $28,100 | $6,250 | $21,850 |
| 2016 | $820 | $20,900 | $5,000 | $15,900 |
| 2015 | $820 | $20,900 | $5,000 | $15,900 |
| 2014 | $820 | $20,900 | $5,000 | $15,900 |
Source: Public Records
Map
Nearby Homes
- 3172 Lauren Evelyn Way
- 3253 Rainwood Dr
- 116 Tiger Cir
- 3247 Masonwood Dr
- 3136 Lauren Evelyn Way
- 3116 Lauren Evelyn Way
- 3313 Leondale Terrace
- 3320 Chesapeake Cir
- 3240 Doverside Dr
- 3225 Sennadale Ln
- 4348 Skyridge Dr
- 4325 Skyridge Dr
- 3214 Doverside Dr
- 3946 Northbrook Dr
- 4125 Walnut Ridge Dr
- 4105 Walnut Ridge Dr
- 4137 Walnut Ridge Dr
- 4113 Walnut Ridge Dr
- 3229 Moorewood Dr
- 1533 Thornton Grove Blvd
- 3336 Moorewood Dr
- 3346 Moorewood Dr
- 3604 Chesapeake Dr
- 3004 Barbara Lynn Way
- 3332 Moorewood Dr
- 3337 Moorewood Dr
- 3008 Barbara Lynn Way
- 3333 Moorewood Dr
- 3608 Chesapeake Dr
- 3012 Barbara Lynn Way
- 3330B Moorewood Dr
- 3016 Barbara Lynn Way
- 3601 Chesapeake Dr
- 3605 Chesapeake Dr
- 3429 Fawnwood Place
- 3438 Fawnwood Place
- 3570 Chesapeake Dr
- 3609 Chesapeake Dr
- 3020 Barbara Lynn Way
- 3581 Chesapeake Dr