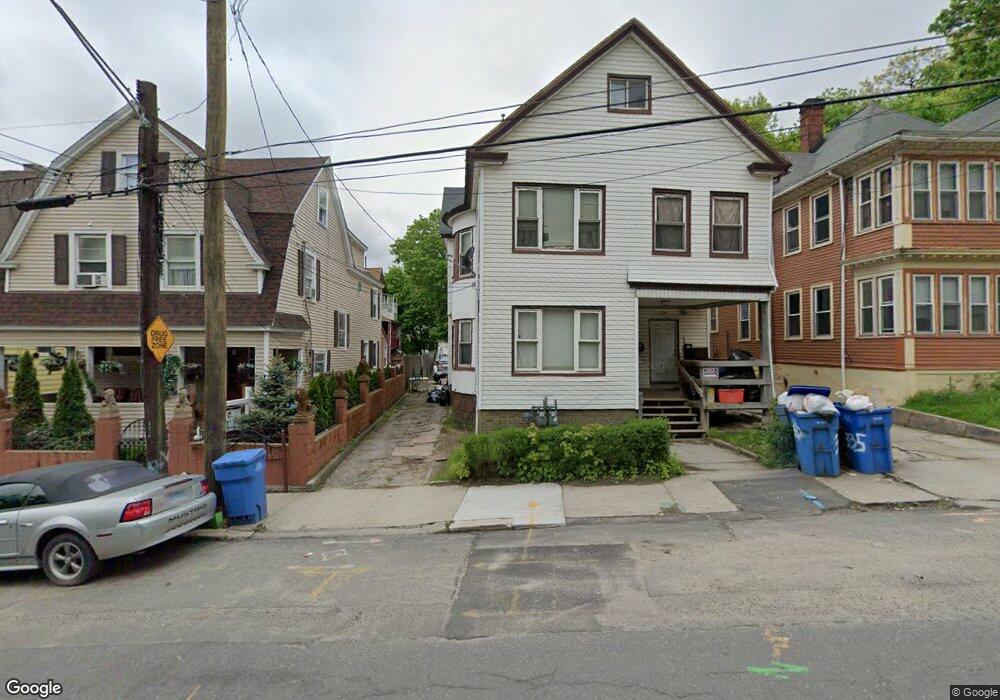
335 Willow St Waterbury, CT 06710
Village of Waterbury NeighborhoodEstimated Value: $191,224 - $306,000
5
Beds
2
Baths
2,586
Sq Ft
$91/Sq Ft
Est. Value
About This Home
This home is located at 335 Willow St, Waterbury, CT 06710 and is currently estimated at $234,556, approximately $90 per square foot. 335 Willow St is a home located in New Haven County with nearby schools including Driggs School, North End Middle School, and Wilby High School.
Ownership History
Date
Name
Owned For
Owner Type
Purchase Details
Closed on
Oct 20, 2021
Sold by
Kozusko Steven J and Kozusko Frances M
Bought by
Monticello Holdings Llc
Current Estimated Value
Home Financials for this Owner
Home Financials are based on the most recent Mortgage that was taken out on this home.
Original Mortgage
$96,000
Outstanding Balance
$87,543
Interest Rate
2.8%
Mortgage Type
Purchase Money Mortgage
Estimated Equity
$147,013
Purchase Details
Closed on
Sep 13, 2019
Sold by
Kosuzko Steven
Bought by
Kozusko Steven and Kozusko Frances
Purchase Details
Closed on
Jul 29, 1994
Sold by
Paragon Group
Bought by
Kozusko Steven and Kozusko Frances
Home Financials for this Owner
Home Financials are based on the most recent Mortgage that was taken out on this home.
Original Mortgage
$47,876
Interest Rate
7.76%
Mortgage Type
Purchase Money Mortgage
Purchase Details
Closed on
Sep 22, 1993
Sold by
Vanagas Edgar
Bought by
Bueno Ernest
Create a Home Valuation Report for This Property
The Home Valuation Report is an in-depth analysis detailing your home's value as well as a comparison with similar homes in the area
Home Values in the Area
Average Home Value in this Area
Purchase History
| Date | Buyer | Sale Price | Title Company |
|---|---|---|---|
| Monticello Holdings Llc | $120,000 | None Available | |
| Kozusko Steven | -- | -- | |
| Kozusko Steven | $59,900 | -- | |
| Bueno Ernest | $12,500 | -- |
Source: Public Records
Mortgage History
| Date | Status | Borrower | Loan Amount |
|---|---|---|---|
| Open | Monticello Holdings Llc | $96,000 | |
| Previous Owner | Bueno Ernest | $47,876 |
Source: Public Records
Tax History Compared to Growth
Tax History
| Year | Tax Paid | Tax Assessment Tax Assessment Total Assessment is a certain percentage of the fair market value that is determined by local assessors to be the total taxable value of land and additions on the property. | Land | Improvement |
|---|---|---|---|---|
| 2025 | $2,676 | $59,500 | $6,930 | $52,570 |
| 2024 | $2,942 | $59,500 | $6,930 | $52,570 |
| 2023 | $3,224 | $59,500 | $6,930 | $52,570 |
| 2022 | $1,370 | $22,760 | $6,930 | $15,830 |
| 2021 | $1,370 | $22,760 | $6,930 | $15,830 |
| 2020 | $1,370 | $22,760 | $6,930 | $15,830 |
| 2019 | $1,370 | $22,760 | $6,930 | $15,830 |
| 2018 | $1,370 | $22,760 | $6,930 | $15,830 |
| 2017 | $1,750 | $29,070 | $6,940 | $22,130 |
| 2016 | $1,750 | $29,070 | $6,940 | $22,130 |
| 2015 | $1,692 | $29,070 | $6,940 | $22,130 |
| 2014 | $1,692 | $29,070 | $6,940 | $22,130 |
Source: Public Records
Map
Nearby Homes
- 37 Plaza Ave
- 81 Clowes Terrace
- 271 Willow St
- 152 Lincoln St Unit 19
- 26 Ridgewood St
- 65 Cables Ave Unit 21
- 57 Ridgewood St
- 184 Buckingham St
- 232 Hillside Ave
- 181 Buckingham St
- 38 Kellogg St
- 133 Willow St
- 50 Chestnut Ave
- 60 Clifton Ave
- 96 Hillside Ave
- 70 Hillside Ave
- 90 Pine St
- 338 Pine St
- 18 Pine St
- 205 Cooke St
- 339 Willow St
- 331 Willow St
- 343 Willow St
- 332 Willow St
- 327 Willow St
- 327 Willow St Unit 2 flr
- 327 Willow St Unit Fl 2
- 327 Willow St Unit Fl 1
- 334 Willow St
- 347 Willow St
- 342 Willow St
- 342 Willow St Unit 3fl
- 342 Willow St Unit 2FL
- 324 Willow St
- 324 Willow St Unit 2
- 324 Willow St Unit 3
- 16 Plaza Ave
- 16 Plaza Ave Unit 1
- 16 Plaza Ave Unit 2
- 16 Plaza Ave Unit 3