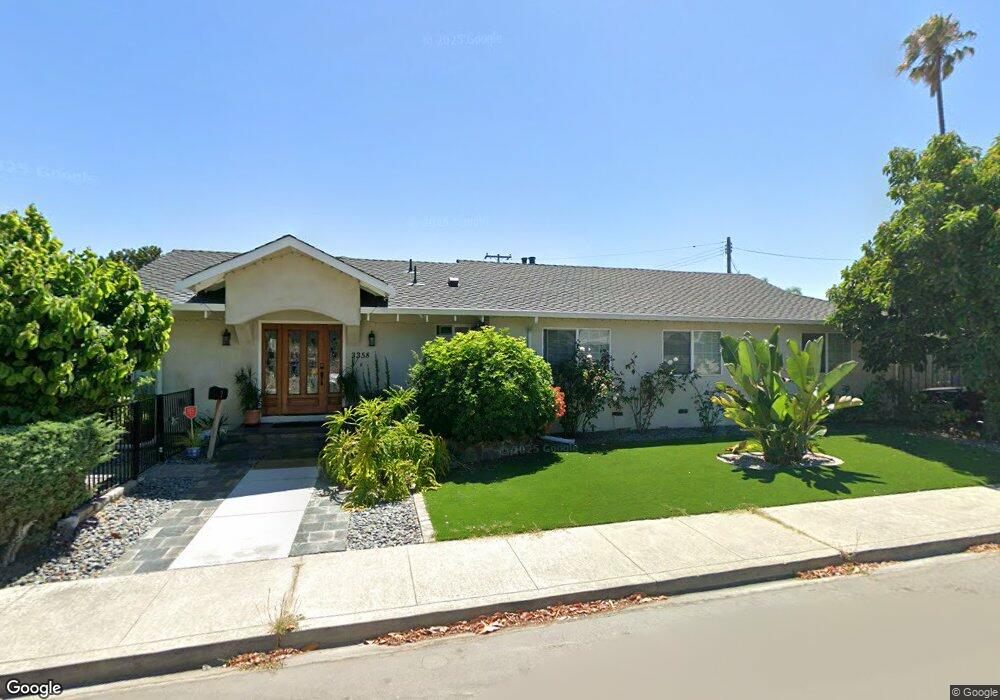
3358 Machado Ave Santa Clara, CA 95051
Estimated Value: $2,054,000 - $2,794,000
4
Beds
2
Baths
1,828
Sq Ft
$1,345/Sq Ft
Est. Value
About This Home
This home is located at 3358 Machado Ave, Santa Clara, CA 95051 and is currently estimated at $2,458,276, approximately $1,344 per square foot. 3358 Machado Ave is a home located in Santa Clara County with nearby schools including Briarwood Elementary School, Juan Cabrillo Middle School, and Adrian Wilcox High School.
Ownership History
Date
Name
Owned For
Owner Type
Purchase Details
Closed on
Oct 24, 2011
Sold by
Guerrero Constancia L and Guerrero Sixto I
Bought by
Guerrero Urbano L and Guerrero Maricar A
Current Estimated Value
Purchase Details
Closed on
Nov 12, 2001
Sold by
Guerrero Connstancia L and Guerrero Sixto I
Bought by
Guerrero Sixto I and Guerrero Constancia L
Home Financials for this Owner
Home Financials are based on the most recent Mortgage that was taken out on this home.
Original Mortgage
$275,000
Interest Rate
6.73%
Purchase Details
Closed on
Nov 3, 2001
Sold by
Guerrero Sixto I and Guerrero Constancia
Bought by
Guerrero Sixto I and Guerrero Constancia L
Home Financials for this Owner
Home Financials are based on the most recent Mortgage that was taken out on this home.
Original Mortgage
$275,000
Interest Rate
6.73%
Create a Home Valuation Report for This Property
The Home Valuation Report is an in-depth analysis detailing your home's value as well as a comparison with similar homes in the area
Home Values in the Area
Average Home Value in this Area
Purchase History
| Date | Buyer | Sale Price | Title Company |
|---|---|---|---|
| Guerrero Urbano L | -- | None Available | |
| Guerrero Sixto I | $220,500 | Alliance Title Company | |
| Guerrero Sixto I | -- | Alliance Title Company |
Source: Public Records
Mortgage History
| Date | Status | Borrower | Loan Amount |
|---|---|---|---|
| Closed | Guerrero Sixto I | $275,000 |
Source: Public Records
Tax History Compared to Growth
Tax History
| Year | Tax Paid | Tax Assessment Tax Assessment Total Assessment is a certain percentage of the fair market value that is determined by local assessors to be the total taxable value of land and additions on the property. | Land | Improvement |
|---|---|---|---|---|
| 2025 | $8,693 | $750,794 | $418,833 | $331,961 |
| 2024 | $8,693 | $736,073 | $410,621 | $325,452 |
| 2023 | $8,605 | $721,641 | $402,570 | $319,071 |
| 2022 | $8,463 | $707,492 | $394,677 | $312,815 |
| 2021 | $8,429 | $693,621 | $386,939 | $306,682 |
| 2020 | $8,276 | $686,510 | $382,972 | $303,538 |
| 2019 | $7,705 | $626,618 | $375,463 | $251,155 |
| 2018 | $6,517 | $553,979 | $368,101 | $185,878 |
| 2017 | $6,485 | $543,118 | $360,884 | $182,234 |
| 2016 | $6,370 | $532,469 | $353,808 | $178,661 |
| 2015 | $6,346 | $524,472 | $348,494 | $175,978 |
| 2014 | $6,027 | $514,199 | $341,668 | $172,531 |
Source: Public Records
Map
Nearby Homes
- 2038 Kington Place
- 2388 Stanford Place
- 3510 Cabrillo Ave
- 3505 Notre Dame Dr
- 3050 Machado Ave
- 1661 Nobili Ave
- 3705 Terstena Place Unit 201
- 3715 Terstena Place Unit 202
- 3725 Terstena Place Unit 140
- 1103 Reed Ave Unit A
- 2516 Parkland Ct
- 2514 Parkland Ct
- 3089 El Camino Real Unit 7
- 3089 El Camino Real Unit 5
- 3089 El Camino Real Unit 9
- 3089 El Camino Real Unit 11
- 3079 El Camino Real Unit 101
- 3079 El Camino Real Unit 202
- 3079 El Camino Real Unit 205
- 1496 Mcpherson St
- 2130 Fordham Dr
- 3368 Machado Ave
- 2121 Rockhurst Ct
- 2120 Fordham Dr
- 2160 Fordham Dr
- 2111 Rockhurst Ct
- 2149 Fordham Dr
- 3349 Machado Ave
- 2110 Fordham Dr
- 2101 Rockhurst Ct
- 3344 Machado Ave
- 2129 Fordham Dr
- 3345 Machado Ave
- 2091 Rockhurst Ct
- 3369 Machado Ave
- 2180 Fordham Dr
- 2100 Fordham Dr
- 2179 Fordham Dr
- 2109 Fordham Dr
- 2132 Rockhurst Ct