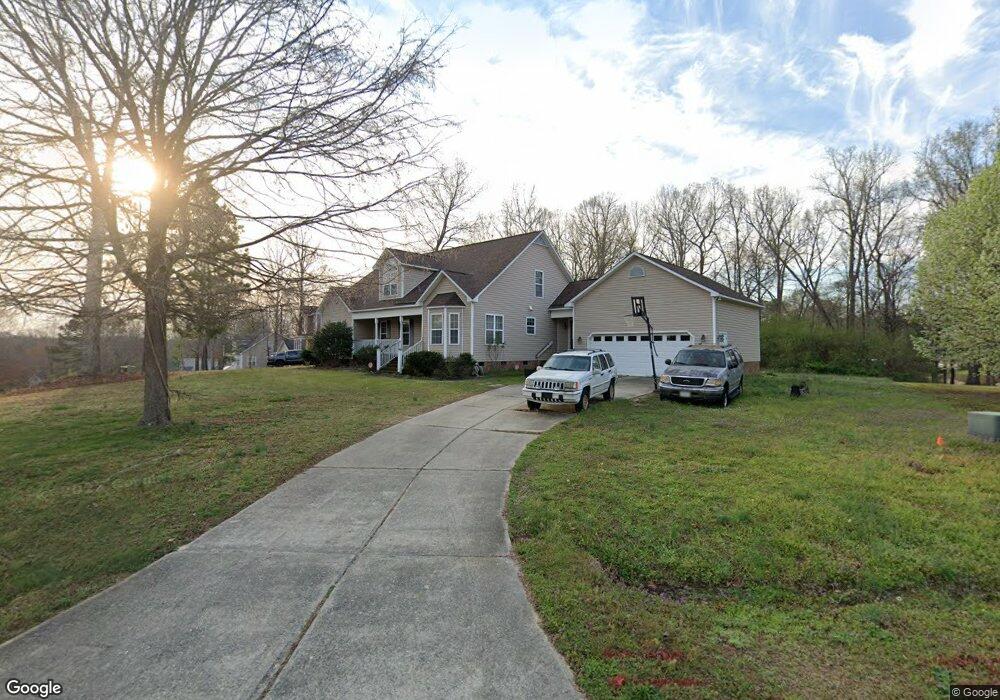
336 Santa Gertrudis Dr Clayton, NC 27520
Estimated Value: $351,000 - $466,000
3
Beds
2
Baths
1,664
Sq Ft
$249/Sq Ft
Est. Value
About This Home
This home is located at 336 Santa Gertrudis Dr, Clayton, NC 27520 and is currently estimated at $414,461, approximately $249 per square foot. 336 Santa Gertrudis Dr is a home located in Johnston County with nearby schools including Polenta Elementary School, Swift Creek Middle, and Cleveland High School.
Ownership History
Date
Name
Owned For
Owner Type
Purchase Details
Closed on
Aug 26, 2010
Sold by
Boddie Tarus M and Boddie Shauna N
Bought by
Boddie Tarus M and Boddie Shauna N
Current Estimated Value
Home Financials for this Owner
Home Financials are based on the most recent Mortgage that was taken out on this home.
Original Mortgage
$220,531
Outstanding Balance
$146,948
Interest Rate
4.62%
Mortgage Type
FHA
Estimated Equity
$267,513
Purchase Details
Closed on
Aug 11, 2006
Sold by
Scott Lee Homes Inc
Bought by
Boddie Tarus M and Norris Shauna
Home Financials for this Owner
Home Financials are based on the most recent Mortgage that was taken out on this home.
Original Mortgage
$177,120
Interest Rate
6.58%
Mortgage Type
FHA
Purchase Details
Closed on
Feb 3, 2006
Sold by
Little Creek Farms Properties Inc
Bought by
Scott Lee Homes Inc
Create a Home Valuation Report for This Property
The Home Valuation Report is an in-depth analysis detailing your home's value as well as a comparison with similar homes in the area
Home Values in the Area
Average Home Value in this Area
Purchase History
| Date | Buyer | Sale Price | Title Company |
|---|---|---|---|
| Boddie Tarus M | -- | None Available | |
| Boddie Tarus M | $180,000 | None Available | |
| Scott Lee Homes Inc | $310,000 | None Available |
Source: Public Records
Mortgage History
| Date | Status | Borrower | Loan Amount |
|---|---|---|---|
| Open | Boddie Tarus M | $220,531 | |
| Closed | Boddie Tarus M | $177,120 |
Source: Public Records
Tax History Compared to Growth
Tax History
| Year | Tax Paid | Tax Assessment Tax Assessment Total Assessment is a certain percentage of the fair market value that is determined by local assessors to be the total taxable value of land and additions on the property. | Land | Improvement |
|---|---|---|---|---|
| 2025 | $2,802 | $441,290 | $80,000 | $361,290 |
| 2024 | $2,108 | $260,260 | $32,000 | $228,260 |
| 2023 | $2,004 | $260,260 | $32,000 | $228,260 |
| 2022 | $2,056 | $260,260 | $32,000 | $228,260 |
| 2021 | $2,056 | $260,260 | $32,000 | $228,260 |
| 2020 | $2,134 | $260,260 | $32,000 | $228,260 |
| 2019 | $2,134 | $260,260 | $32,000 | $228,260 |
| 2018 | $1,990 | $236,870 | $25,000 | $211,870 |
| 2017 | $1,990 | $236,870 | $25,000 | $211,870 |
| 2016 | $1,990 | $236,870 | $25,000 | $211,870 |
| 2015 | $1,990 | $236,870 | $25,000 | $211,870 |
| 2014 | $1,990 | $236,870 | $25,000 | $211,870 |
Source: Public Records
Map
Nearby Homes
- 60 Branding Iron Dr
- 2005 Mooregate Ct
- 75 Santa Gertrudis Dr
- 210 Clearwater Ct
- 196 Cozy Brook Ct
- 109 Fountain Dr
- 76 Cozy Brook Ct
- 346 Silver Creek Dr
- 391 Crystal Creek Dr
- 380 Cooper Branch Rd
- KAYLEEN Plan at Cooper Branch
- EPIPHANY Plan at Cooper Branch
- ALTON Plan at Cooper Branch
- MEADOW Plan at Cooper Branch
- AURORA Plan at Cooper Branch
- PARKETTE Plan at Cooper Branch
- BRADLEY II Plan at Cooper Branch
- GRACE Plan at Cooper Branch
- VANDERBURGH Plan at Cooper Branch
- HORIZON Plan at Cooper Branch
- 36 Branding Iron Dr
- 324 Santa Gertrudis Dr
- 46 Branding Iron Dr
- 66 Branding Iron Dr
- 306 Santa Gertrudis Dr
- 2205 Heather Downs Ln
- 27 Branding Iron Dr
- 313 Santa Gertrudis Dr
- 69 Branding Iron Dr
- 353 Santa Gertrudis Dr
- 2004 Moorgate Ct
- 82 Branding Iron Dr
- 290 Santa Gertrudis Dr
- 293 Santa Gertrudis Dr
- 2000 Moorgate Ct
- 384 Santa Gertrudis Dr
- 104 Branding Iron Dr
- 377 Santa Gertrudis Dr
- 274 Santa Gertrudis Dr
- 452 Santa Gertrudis Dr