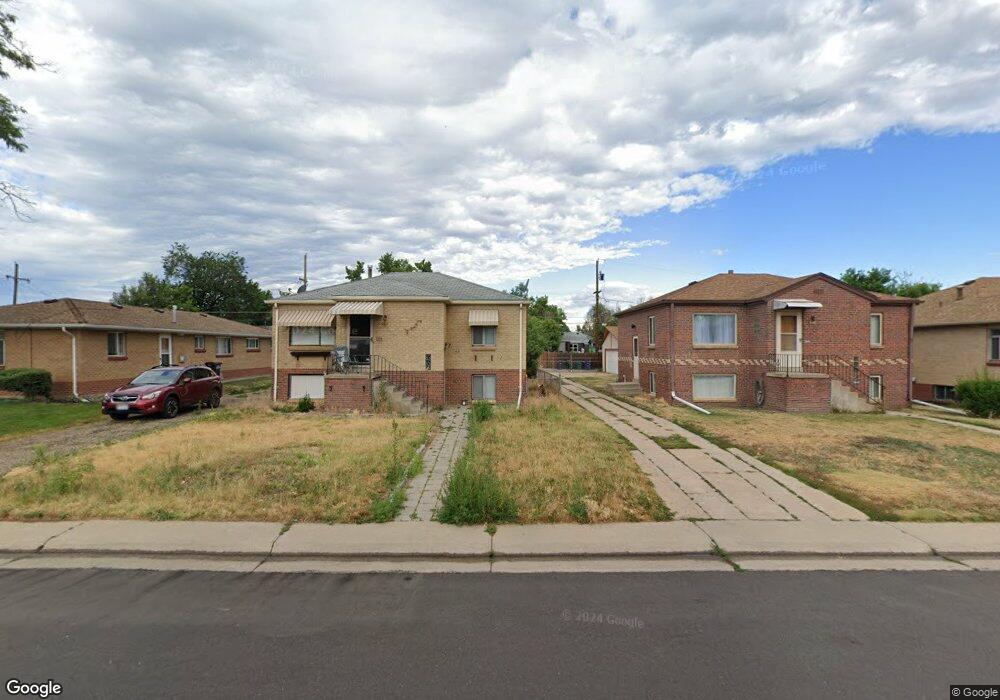
3361 Leyden St Denver, CO 80207
Northeast Park Hill NeighborhoodEstimated Value: $650,500 - $712,000
2
Beds
1
Bath
860
Sq Ft
$792/Sq Ft
Est. Value
About This Home
This home is located at 3361 Leyden St, Denver, CO 80207 and is currently estimated at $681,250, approximately $792 per square foot. 3361 Leyden St is a home located in Denver County with nearby schools including Margaret M Smith Elementary School, William (Bill) Roberts ECE-8 School, and McAuliffe International School.
Ownership History
Date
Name
Owned For
Owner Type
Purchase Details
Closed on
Oct 30, 2014
Sold by
Nickerson Bryan E and Nickerson Karla
Bought by
Gagnon Robert H
Current Estimated Value
Home Financials for this Owner
Home Financials are based on the most recent Mortgage that was taken out on this home.
Original Mortgage
$245,854
Outstanding Balance
$190,054
Interest Rate
4.25%
Mortgage Type
VA
Estimated Equity
$491,196
Purchase Details
Closed on
Jun 21, 1999
Sold by
Bruce Decker and Bruce Kimberly
Bought by
Smbc Inc
Home Financials for this Owner
Home Financials are based on the most recent Mortgage that was taken out on this home.
Original Mortgage
$98,625
Interest Rate
7.02%
Purchase Details
Closed on
Oct 13, 1997
Sold by
Hunter Oliver M
Bought by
Decker Bruce and Decker Kimberly
Home Financials for this Owner
Home Financials are based on the most recent Mortgage that was taken out on this home.
Original Mortgage
$99,300
Interest Rate
8.25%
Mortgage Type
Seller Take Back
Create a Home Valuation Report for This Property
The Home Valuation Report is an in-depth analysis detailing your home's value as well as a comparison with similar homes in the area
Home Values in the Area
Average Home Value in this Area
Purchase History
| Date | Buyer | Sale Price | Title Company |
|---|---|---|---|
| Gagnon Robert H | $238,000 | Guardian Title | |
| Smbc Inc | $131,500 | Land Title | |
| Decker Bruce | $113,300 | First American Heritage Titl |
Source: Public Records
Mortgage History
| Date | Status | Borrower | Loan Amount |
|---|---|---|---|
| Open | Gagnon Robert H | $245,854 | |
| Previous Owner | Smbc Inc | $98,625 | |
| Previous Owner | Decker Bruce | $99,300 |
Source: Public Records
Tax History Compared to Growth
Tax History
| Year | Tax Paid | Tax Assessment Tax Assessment Total Assessment is a certain percentage of the fair market value that is determined by local assessors to be the total taxable value of land and additions on the property. | Land | Improvement |
|---|---|---|---|---|
| 2024 | $3,616 | $45,650 | $8,870 | $36,780 |
| 2023 | $3,537 | $45,650 | $8,870 | $36,780 |
| 2022 | $2,428 | $30,530 | $8,490 | $22,040 |
| 2021 | $2,395 | $32,100 | $8,930 | $23,170 |
| 2020 | $2,246 | $30,270 | $8,930 | $21,340 |
| 2019 | $2,183 | $30,270 | $8,930 | $21,340 |
| 2018 | $1,702 | $22,000 | $5,850 | $16,150 |
| 2017 | $1,697 | $22,000 | $5,850 | $16,150 |
| 2016 | $1,593 | $19,530 | $5,970 | $13,560 |
| 2015 | $1,526 | $19,530 | $5,970 | $13,560 |
| 2014 | $1,251 | $15,060 | $3,980 | $11,080 |
Source: Public Records
Map
Nearby Homes
- 3395 Locust St
- 3295 Krameria St
- 3355 N Monaco Street Pkwy
- 3381 Kearney St
- 3269 Krameria St
- 6325 Martin Luther King Junior Blvd
- 3360 Magnolia St
- 3653 Locust St
- 3625 Kearney St
- 3601 Jasmine St
- 3690 Leyden St
- 3540 Niagara St
- 3045 N Monaco Street Pkwy
- 3630 Magnolia St
- 3035 N Monaco Street Pkwy
- 3040 Jasmine St
- 3685 Jasmine St
- 3670 Magnolia St
- 3398 Newport St
- 3690 Magnolia St
- 3359 Leyden St
- 3365 Leyden St
- 3339 Leyden St
- 3373 Leyden St
- 3385 Leyden St
- 3366 Krameria St
- 3356 Leyden St
- 3360 Krameria St
- 3370 Krameria St
- 3348 Leyden St
- 3364 Leyden St
- 3333 Leyden St
- 3376 Krameria St
- 3370 Leyden St
- 3350 Krameria St
- 3391 Leyden St
- 3340 Krameria St
- 3384 Krameria St
- 3332 Leyden St
- 3380 Leyden St