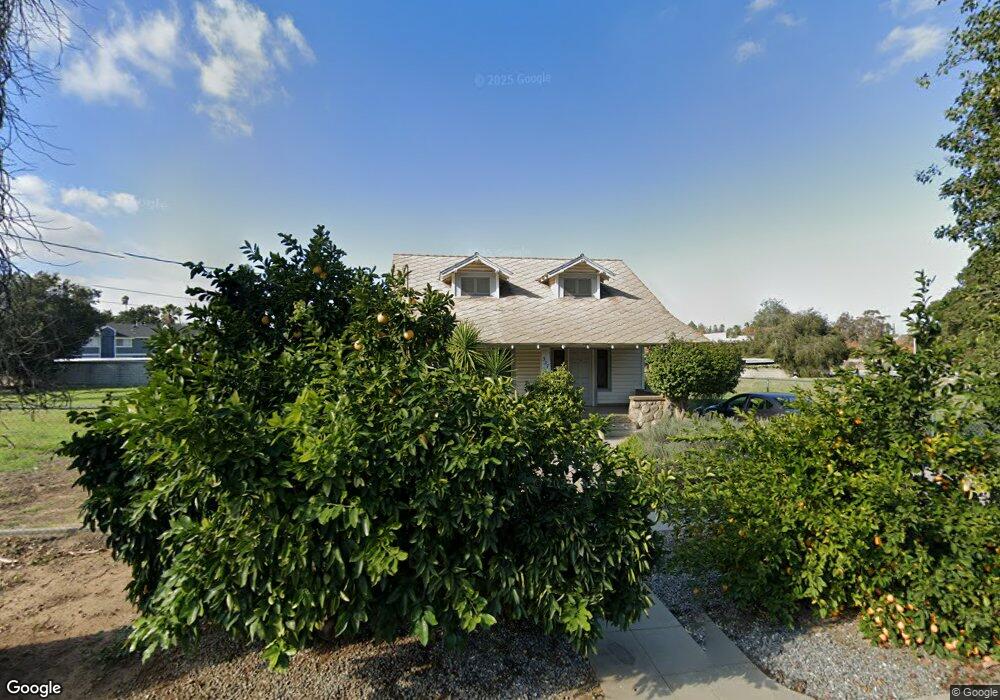
337 Cook St Redlands, CA 92374
North Redlands NeighborhoodEstimated Value: $409,000 - $566,000
2
Beds
1
Bath
1,436
Sq Ft
$354/Sq Ft
Est. Value
About This Home
This home is located at 337 Cook St, Redlands, CA 92374 and is currently estimated at $507,696, approximately $353 per square foot. 337 Cook St is a home located in San Bernardino County with nearby schools including Crafton Elementary School, Moore Middle School, and Redlands East Valley High School.
Ownership History
Date
Name
Owned For
Owner Type
Purchase Details
Closed on
Jul 15, 2002
Sold by
Churchill John V and Churchill Pamela
Bought by
Redlands Property Management Inc and The Redlands Property Management Trust
Current Estimated Value
Purchase Details
Closed on
Mar 24, 1997
Sold by
Churchill John V
Bought by
Churchill John V and Churchill Pamela P
Home Financials for this Owner
Home Financials are based on the most recent Mortgage that was taken out on this home.
Original Mortgage
$120,000
Interest Rate
5.87%
Create a Home Valuation Report for This Property
The Home Valuation Report is an in-depth analysis detailing your home's value as well as a comparison with similar homes in the area
Home Values in the Area
Average Home Value in this Area
Purchase History
| Date | Buyer | Sale Price | Title Company |
|---|---|---|---|
| Redlands Property Management Inc | $301,000 | Chicago Title Co | |
| Churchill John V | -- | Commonwealth Land Title Co |
Source: Public Records
Mortgage History
| Date | Status | Borrower | Loan Amount |
|---|---|---|---|
| Previous Owner | Churchill John V | $120,000 |
Source: Public Records
Tax History Compared to Growth
Tax History
| Year | Tax Paid | Tax Assessment Tax Assessment Total Assessment is a certain percentage of the fair market value that is determined by local assessors to be the total taxable value of land and additions on the property. | Land | Improvement |
|---|---|---|---|---|
| 2025 | $2,698 | $230,290 | $85,455 | $144,835 |
| 2024 | $2,698 | $225,774 | $83,779 | $141,995 |
| 2023 | $2,695 | $221,347 | $82,136 | $139,211 |
| 2022 | $2,656 | $217,006 | $80,525 | $136,481 |
| 2021 | $2,704 | $212,751 | $78,946 | $133,805 |
| 2020 | $2,664 | $210,570 | $78,137 | $132,433 |
| 2019 | $2,590 | $206,441 | $76,605 | $129,836 |
| 2018 | $2,526 | $202,393 | $75,103 | $127,290 |
| 2017 | $2,505 | $198,424 | $73,630 | $124,794 |
| 2016 | $2,477 | $194,533 | $72,186 | $122,347 |
| 2015 | $2,459 | $191,611 | $71,102 | $120,509 |
| 2014 | $2,415 | $187,857 | $69,709 | $118,148 |
Source: Public Records
Map
Nearby Homes
- 1318 Stillman Ave
- 455 Judson St
- 110 Judson St
- 743 Mcauliffe Ct
- 259 East Dr
- 909 Stillman Ave
- 1427 Laramie Ave
- 450 Judson St
- 327 Naomi St
- 501 Lemon St
- 149 Lido St
- 818 E Colton Ave
- 1033 Evergreen Ct
- 825 E Colton Ave
- 1205 N University St
- Belmont Plan at Havenwood
- Camden Plan at Havenwood
- Lexington Plan at Havenwood
- Windsor Plan at Havenwood
- 1200 E Highland Ave Unit 207
- 1143 E Central Ave
- 1203 E Central Ave
- 1207 E Central Ave Unit 1/2
- 1207 E Central Ave
- 1125 E Central Ave
- 1125 E Central Ave
- 1209 1/2 E Central Ave
- 1209 E Central Ave
- 1144 E Central Ave
- 1132 E Central Ave
- 1130 E Central Ave Unit 1
- 1130 E Central Ave
- 1123 E Central Ave
- 135 Cook St Unit 1
- 135 Cook St
- 1211 E Central Ave
- 1126 E Central Ave
- 1119 E Central Ave
- 1135 Cero Ct Unit 2
- 1135 Cero Ct