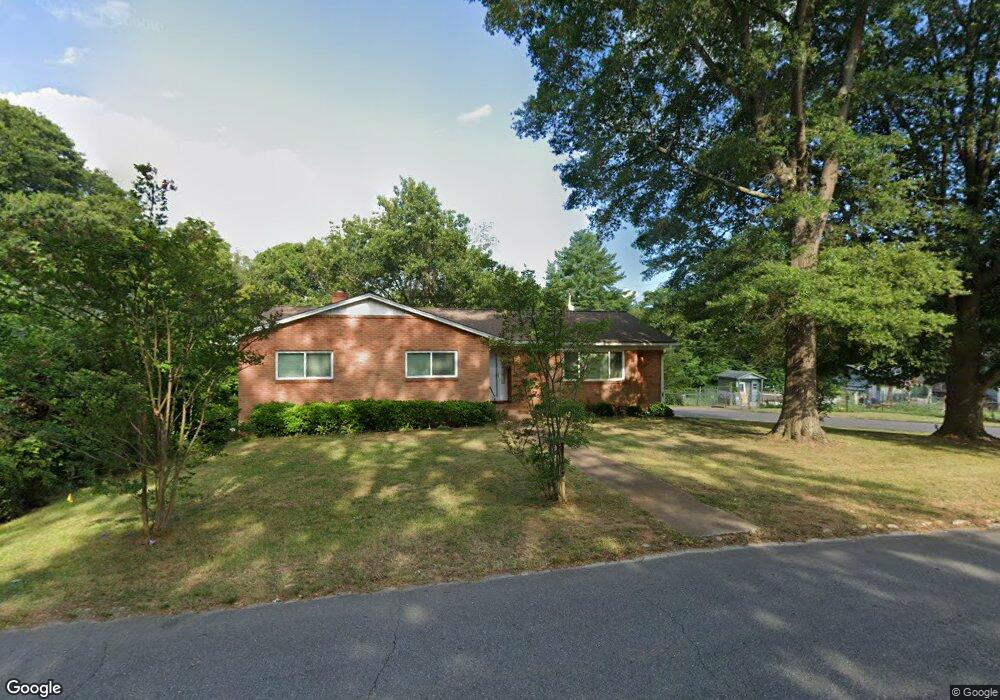
337 Gold St Shelby, NC 28150
Estimated Value: $200,529 - $299,000
--
Bed
--
Bath
2,298
Sq Ft
$115/Sq Ft
Est. Value
About This Home
This home is located at 337 Gold St, Shelby, NC 28150 and is currently estimated at $263,882, approximately $114 per square foot. 337 Gold St is a home located in Cleveland County with nearby schools including Graham Elementary School, Shelby Middle School, and Shelby High School.
Ownership History
Date
Name
Owned For
Owner Type
Purchase Details
Closed on
Jun 18, 2021
Sold by
Davis Fred Delane and Davis Debbie
Bought by
Hillord Glenn and Hillord Lesley N
Current Estimated Value
Home Financials for this Owner
Home Financials are based on the most recent Mortgage that was taken out on this home.
Original Mortgage
$184,140
Outstanding Balance
$166,716
Interest Rate
2.9%
Mortgage Type
VA
Estimated Equity
$97,166
Purchase Details
Closed on
Mar 17, 2006
Sold by
Davis Mary Lou W
Bought by
Davis Fred Delane and Davis Boyer Cynthia Anita
Create a Home Valuation Report for This Property
The Home Valuation Report is an in-depth analysis detailing your home's value as well as a comparison with similar homes in the area
Home Values in the Area
Average Home Value in this Area
Purchase History
| Date | Buyer | Sale Price | Title Company |
|---|---|---|---|
| Hillord Glenn | $180,000 | None Available | |
| Davis Fred Delane | -- | None Available |
Source: Public Records
Mortgage History
| Date | Status | Borrower | Loan Amount |
|---|---|---|---|
| Open | Hillord Glenn | $184,140 |
Source: Public Records
Tax History Compared to Growth
Tax History
| Year | Tax Paid | Tax Assessment Tax Assessment Total Assessment is a certain percentage of the fair market value that is determined by local assessors to be the total taxable value of land and additions on the property. | Land | Improvement |
|---|---|---|---|---|
| 2025 | $2,107 | $211,780 | $13,910 | $197,870 |
| 2024 | $1,363 | $111,061 | $11,426 | $99,635 |
| 2023 | $1,356 | $111,061 | $11,426 | $99,635 |
| 2022 | $1,356 | $111,061 | $11,426 | $99,635 |
| 2021 | $1,363 | $111,061 | $11,426 | $99,635 |
| 2020 | $1,057 | $83,335 | $11,426 | $71,909 |
| 2019 | $1,057 | $83,335 | $11,426 | $71,909 |
| 2018 | $1,056 | $83,335 | $11,426 | $71,909 |
| 2017 | $1,030 | $83,335 | $11,426 | $71,909 |
| 2016 | $1,033 | $83,335 | $11,426 | $71,909 |
| 2015 | $1,337 | $114,119 | $11,426 | $102,693 |
| 2014 | $1,337 | $114,119 | $11,426 | $102,693 |
Source: Public Records
Map
Nearby Homes