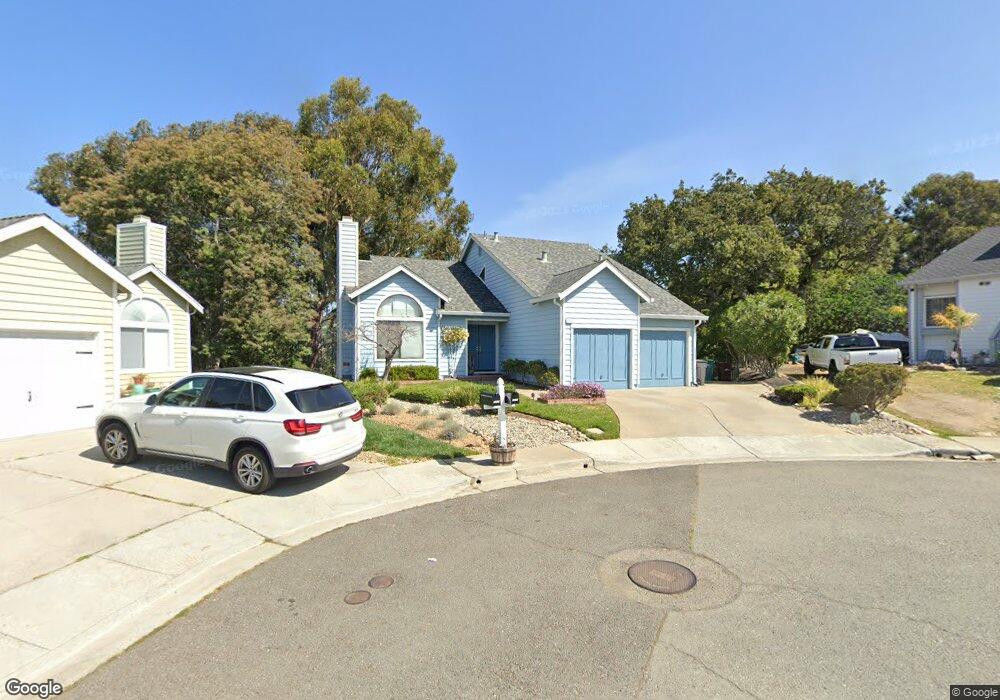
3374 Creek View Ct Hayward, CA 94541
Estimated Value: $874,000 - $1,114,143
3
Beds
3
Baths
1,804
Sq Ft
$571/Sq Ft
Est. Value
About This Home
This home is located at 3374 Creek View Ct, Hayward, CA 94541 and is currently estimated at $1,030,286, approximately $571 per square foot. 3374 Creek View Ct is a home located in Alameda County with nearby schools including Fairview Elementary School, Bret Harte Middle School, and Hayward High School.
Ownership History
Date
Name
Owned For
Owner Type
Purchase Details
Closed on
Feb 17, 2000
Sold by
Corella Francisco and Corella Karen P
Bought by
Lochrie Michael A
Current Estimated Value
Home Financials for this Owner
Home Financials are based on the most recent Mortgage that was taken out on this home.
Original Mortgage
$292,000
Outstanding Balance
$96,527
Interest Rate
8.16%
Estimated Equity
$933,759
Purchase Details
Closed on
Jun 15, 1999
Sold by
Alex Dan A and Alex Sandra H
Bought by
Corella Francisco and Corella Karen P
Home Financials for this Owner
Home Financials are based on the most recent Mortgage that was taken out on this home.
Original Mortgage
$271,600
Interest Rate
7.01%
Purchase Details
Closed on
Feb 10, 1995
Sold by
Alex Dan A and Alex Sandra H
Bought by
Alex Dan A and Alex Sandra H
Create a Home Valuation Report for This Property
The Home Valuation Report is an in-depth analysis detailing your home's value as well as a comparison with similar homes in the area
Home Values in the Area
Average Home Value in this Area
Purchase History
| Date | Buyer | Sale Price | Title Company |
|---|---|---|---|
| Lochrie Michael A | $365,000 | North American Title Co | |
| Corella Francisco | $339,500 | North American Title Co | |
| Alex Dan A | -- | -- |
Source: Public Records
Mortgage History
| Date | Status | Borrower | Loan Amount |
|---|---|---|---|
| Open | Lochrie Michael A | $292,000 | |
| Previous Owner | Corella Francisco | $271,600 | |
| Closed | Corella Francisco | $50,850 |
Source: Public Records
Tax History Compared to Growth
Tax History
| Year | Tax Paid | Tax Assessment Tax Assessment Total Assessment is a certain percentage of the fair market value that is determined by local assessors to be the total taxable value of land and additions on the property. | Land | Improvement |
|---|---|---|---|---|
| 2025 | $6,590 | $497,867 | $112,192 | $392,675 |
| 2024 | $6,590 | $487,970 | $109,993 | $384,977 |
| 2023 | $6,522 | $485,266 | $107,837 | $377,429 |
| 2022 | $6,371 | $468,752 | $105,722 | $370,030 |
| 2021 | $6,292 | $459,426 | $103,650 | $362,776 |
| 2020 | $6,192 | $461,647 | $102,588 | $359,059 |
| 2019 | $6,216 | $452,597 | $100,577 | $352,020 |
| 2018 | $5,836 | $443,724 | $98,605 | $345,119 |
| 2017 | $5,691 | $435,025 | $96,672 | $338,353 |
| 2016 | $5,364 | $426,497 | $94,777 | $331,720 |
| 2015 | $5,247 | $420,091 | $93,353 | $326,738 |
| 2014 | $4,991 | $411,863 | $91,525 | $320,338 |
Source: Public Records
Map
Nearby Homes
- 3287 Kelly St
- 22633 Mossy Rock Dr
- 3260 Jamie Way
- 22679 Valley View Dr
- 23049 Lakeridge Ave
- 22561 Mossy Rock Dr
- 3285 Monika Ln
- 3241 Monika Ln
- 3264 Monika Ln
- 2936 Pickford Way
- 24392 Machado Ct
- 3238 Monika Ln
- 23066 Maud Ave
- 3606 Sarita St
- 2980 D St
- 25657 Crestfield Dr
- 0 Jensen Rd Unit 41089385
- 3109 Vista Ln
- 23022 Palazzo Del Kayla
- 23661 Glenbrook Ln
- 3362 Creek View Ct
- 3368 Creek View Ct
- 3373 Creek View Ct
- 3361 Creek View Ct
- 3367 Creek View Ct
- 3367 Creek View Ct
- 23054 Henry Ln
- 3356 Creek View Ct
- 23032 Henry Ln
- 0 Henry Ln Unit 40673097
- 0 Henry Ln Unit 40700386
- 23062 Henry Ln
- 23064 Henry Ln
- 23047 Henry Ln
- 23047 Henry Ln
- 23070 Henry Ln
- 23066 Henry Ln
- 23063 Henry Ln
- 23031 Henry Ln
- 23067 Henry Ln