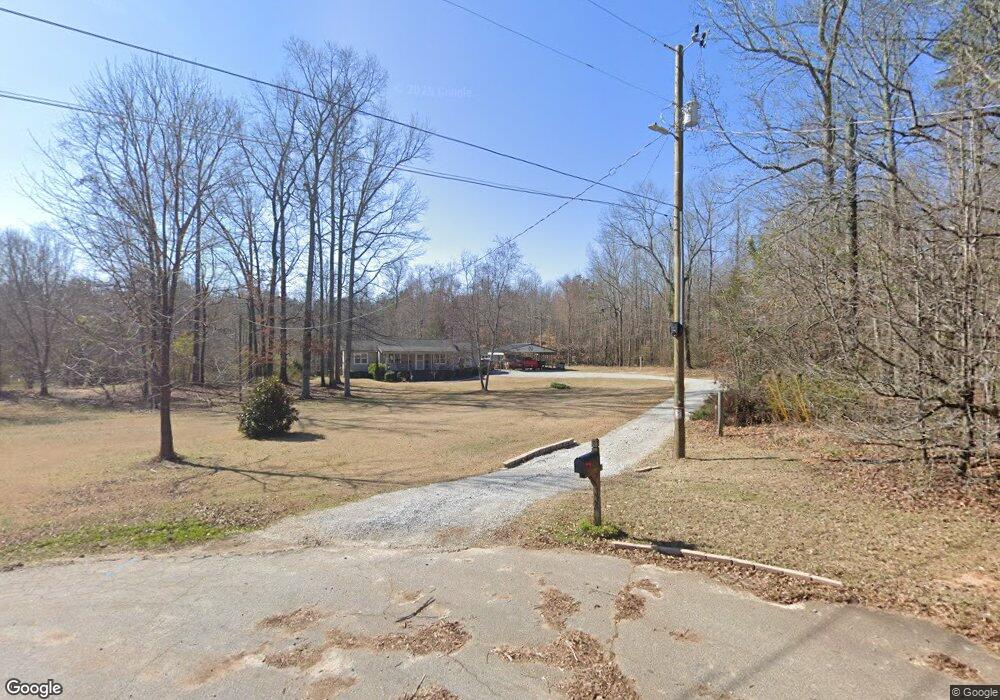
339 Bar h Rd Griffin, GA 30223
Spalding County NeighborhoodEstimated Value: $251,000 - $299,000
3
Beds
2
Baths
1,392
Sq Ft
$192/Sq Ft
Est. Value
About This Home
This home is located at 339 Bar h Rd, Griffin, GA 30223 and is currently estimated at $267,323, approximately $192 per square foot. 339 Bar h Rd is a home located in Spalding County with nearby schools including Jordan Hill Road Elementary School, Kennedy Road Middle School, and Spalding High School.
Ownership History
Date
Name
Owned For
Owner Type
Purchase Details
Closed on
May 15, 1998
Sold by
Coggins Timothy R and Coggins Kathy D
Bought by
Newton Jeffrey S and Newton Amanda C
Current Estimated Value
Home Financials for this Owner
Home Financials are based on the most recent Mortgage that was taken out on this home.
Original Mortgage
$81,900
Outstanding Balance
$15,919
Interest Rate
7.04%
Mortgage Type
New Conventional
Estimated Equity
$251,404
Purchase Details
Closed on
Jun 9, 1987
Sold by
Walker Dianne
Bought by
Coggins Timothy Ray and Coggins Kathy
Purchase Details
Closed on
Mar 16, 1984
Sold by
Whitted Robert R
Bought by
Walker Dianne
Purchase Details
Closed on
Nov 1, 1983
Sold by
Whitted Robert R and Whitted Jennie L
Bought by
Whitted Robert R
Purchase Details
Closed on
Nov 5, 1982
Sold by
Hill Ruby C Etal
Bought by
Whitted Robert R and Whitted Jennie L
Purchase Details
Closed on
May 15, 1981
Sold by
Huey Gerald S
Bought by
Hill Ruby C Etal
Purchase Details
Closed on
Aug 7, 1979
Sold by
Hill Al S Etal
Bought by
Huey Gerald S
Purchase Details
Closed on
Nov 25, 1969
Bought by
Hill Al S Etal
Create a Home Valuation Report for This Property
The Home Valuation Report is an in-depth analysis detailing your home's value as well as a comparison with similar homes in the area
Home Values in the Area
Average Home Value in this Area
Purchase History
| Date | Buyer | Sale Price | Title Company |
|---|---|---|---|
| Newton Jeffrey S | $81,900 | -- | |
| Coggins Timothy Ray | $54,000 | -- | |
| Walker Dianne | $10,000 | -- | |
| Whitted Robert R | -- | -- | |
| Whitted Robert R | $7,700 | -- | |
| Hill Ruby C Etal | $4,000 | -- | |
| Huey Gerald S | $7,700 | -- | |
| Hill Al S Etal | -- | -- |
Source: Public Records
Mortgage History
| Date | Status | Borrower | Loan Amount |
|---|---|---|---|
| Open | Newton Jeffrey S | $81,900 |
Source: Public Records
Tax History Compared to Growth
Tax History
| Year | Tax Paid | Tax Assessment Tax Assessment Total Assessment is a certain percentage of the fair market value that is determined by local assessors to be the total taxable value of land and additions on the property. | Land | Improvement |
|---|---|---|---|---|
| 2024 | $2,346 | $67,394 | $15,200 | $52,194 |
| 2023 | $2,346 | $49,786 | $15,200 | $34,586 |
| 2022 | $1,435 | $41,281 | $12,160 | $29,121 |
| 2021 | $1,285 | $37,161 | $12,160 | $25,001 |
| 2020 | $1,040 | $30,294 | $12,160 | $18,134 |
| 2019 | $1,060 | $30,294 | $12,160 | $18,134 |
| 2018 | $1,030 | $28,756 | $12,160 | $16,596 |
| 2017 | $1,002 | $28,756 | $12,160 | $16,596 |
| 2016 | $1,020 | $28,756 | $12,160 | $16,596 |
| 2015 | $1,051 | $28,756 | $12,160 | $16,596 |
| 2014 | $1,072 | $28,756 | $12,160 | $16,596 |
Source: Public Records
Map
Nearby Homes
- 3232 Teamon Rd
- 3264 Teamon Rd
- Belfort Plan at Teamon Pointe
- Hayden Plan at Teamon Pointe
- Galen Plan at Teamon Pointe
- Penwell Plan at Teamon Pointe
- 2050 N Mcdonough Rd
- 1002 Queens Bridge Way
- 2985 Teamon Rd
- 615 N Mcdonough Rd
- 221 Little Gem Ct
- 2270 N Mcdonough Rd
- 176 Smoak Field Rd
- 1013 Queens Bridge Way
- 1131 Leconte Ct
- 1015 Queens Bridge Way
- 1134 Leconte Ct
- 1020 Queens Bridge Way
- 1017 Queens Bridge Way
- 55 Smoak Rd