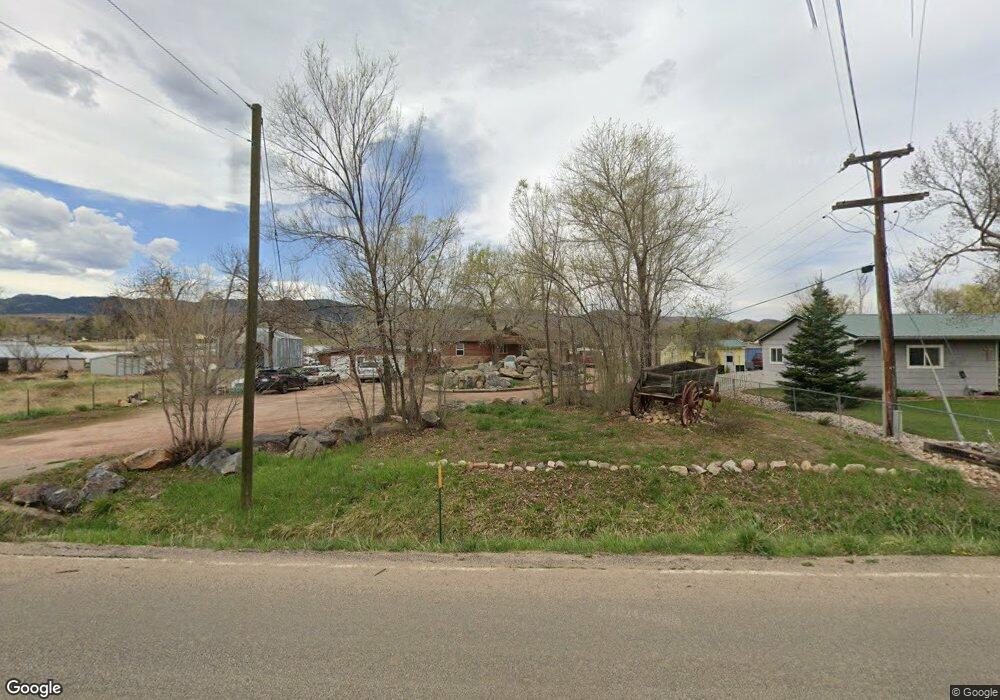
339 N Hollywood St Fort Collins, CO 80521
Estimated Value: $497,000 - $706,642
3
Beds
2
Baths
1,339
Sq Ft
$464/Sq Ft
Est. Value
About This Home
This home is located at 339 N Hollywood St, Fort Collins, CO 80521 and is currently estimated at $621,661, approximately $464 per square foot. 339 N Hollywood St is a home located in Larimer County with nearby schools including Irish Elementary School, Lincoln Middle School, and Poudre High School.
Ownership History
Date
Name
Owned For
Owner Type
Purchase Details
Closed on
Feb 12, 2015
Sold by
Langel Jennifer T and Baca Jennifer T
Bought by
Baca Jennifer T
Current Estimated Value
Purchase Details
Closed on
Jan 3, 2002
Sold by
Baca Jennifer
Bought by
Langel Jennifer T
Home Financials for this Owner
Home Financials are based on the most recent Mortgage that was taken out on this home.
Original Mortgage
$212,800
Interest Rate
6.8%
Mortgage Type
Balloon
Purchase Details
Closed on
Jun 8, 2000
Sold by
Langel George and Baca Jennifer
Bought by
Baca Jennifer
Home Financials for this Owner
Home Financials are based on the most recent Mortgage that was taken out on this home.
Original Mortgage
$180,000
Interest Rate
8.13%
Purchase Details
Closed on
Nov 3, 1999
Sold by
Davidson Bruce H
Bought by
Langel George and Baca Jennifer
Purchase Details
Closed on
Apr 1, 1993
Sold by
Davidson Peter
Bought by
Davidson Bruce H
Create a Home Valuation Report for This Property
The Home Valuation Report is an in-depth analysis detailing your home's value as well as a comparison with similar homes in the area
Home Values in the Area
Average Home Value in this Area
Purchase History
| Date | Buyer | Sale Price | Title Company |
|---|---|---|---|
| Baca Jennifer T | -- | None Available | |
| Langel Jennifer T | -- | Land Title Guarantee Company | |
| Baca Jennifer | -- | -- | |
| Langel George | $62,000 | Security Title | |
| Davidson Bruce H | -- | -- |
Source: Public Records
Mortgage History
| Date | Status | Borrower | Loan Amount |
|---|---|---|---|
| Closed | Langel Jennifer T | $212,800 | |
| Previous Owner | Baca Jennifer | $180,000 |
Source: Public Records
Tax History Compared to Growth
Tax History
| Year | Tax Paid | Tax Assessment Tax Assessment Total Assessment is a certain percentage of the fair market value that is determined by local assessors to be the total taxable value of land and additions on the property. | Land | Improvement |
|---|---|---|---|---|
| 2025 | $4,055 | $45,399 | $9,045 | $36,354 |
| 2024 | $3,860 | $45,399 | $9,045 | $36,354 |
| 2022 | $3,401 | $35,626 | $6,255 | $29,371 |
| 2021 | $3,430 | $36,651 | $6,435 | $30,216 |
| 2020 | $2,965 | $31,410 | $6,435 | $24,975 |
| 2019 | $2,979 | $31,410 | $6,435 | $24,975 |
| 2018 | $2,410 | $26,215 | $4,176 | $22,039 |
| 2017 | $2,402 | $26,215 | $4,176 | $22,039 |
| 2016 | $1,832 | $19,892 | $4,617 | $15,275 |
| 2015 | $1,819 | $19,900 | $4,620 | $15,280 |
| 2014 | $1,859 | $20,200 | $2,990 | $17,210 |
Source: Public Records
Map
Nearby Homes
- 420 N Hollywood St
- 2810 Cherry Ln
- 329 N Sunset St
- 410 High Ct
- 508 N Sunset St
- 2708 Laporte Ave
- 2704 Laporte Ave
- 2908 W Olive St Unit 2908
- 2812 W Woodford Ave Unit 2810A
- 400 S Overland Trail Unit 6
- 0 Laporte Ave
- 501 Locust Grove Dr
- 2028 Laporte Ave
- 209 N Taft Hill Rd
- 123 County Road 19
- 2121 Liberty Dr
- 3075 Headwater Dr
- 720 S Overland Trail
- 1361 Bubbling Brook Ct
- 2519 Timber Ct
- 2917 Cherry Ln
- 2918 Cherry Ln
- 2935 Cherry Ln
- 345 N Hollywood St
- 2934 Cherry Ln
- 321 N Hollywood St
- 317 N Hollywood St
- 417 N Hollywood St
- 417 N Hollywood St Unit 3
- 320 N Hollywood St
- 406 N Hollywood St
- 503 N Hollywood St
- 416 N Hollywood St
- 2821 Cherry Ln
- 241 N Hollywood St
- 505 N Hollywood St
- 240 N Hollywood St
- 2817 Cherry Ln
- 430 N Hollywood St
- 2820 Cherry Ln