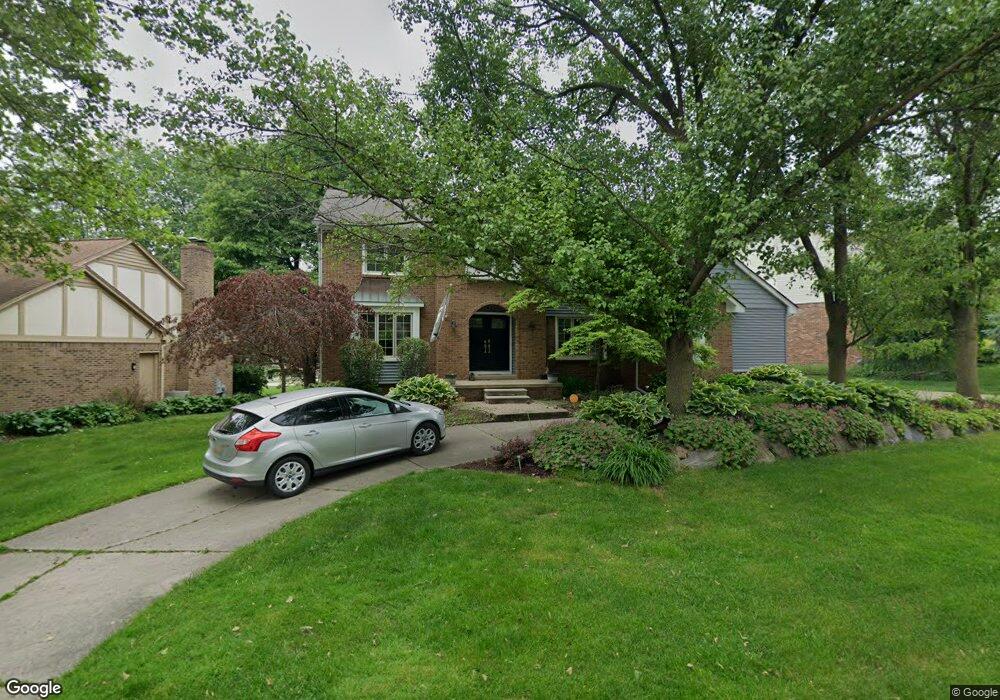
339 Rose Brier Dr Rochester Hills, MI 48309
Estimated Value: $512,253 - $612,000
4
Beds
3
Baths
2,570
Sq Ft
$215/Sq Ft
Est. Value
About This Home
This home is located at 339 Rose Brier Dr, Rochester Hills, MI 48309 and is currently estimated at $553,313, approximately $215 per square foot. 339 Rose Brier Dr is a home located in Oakland County with nearby schools including Meadow Brook Elementary School, West Middle School, and Rochester Adams High School.
Ownership History
Date
Name
Owned For
Owner Type
Purchase Details
Closed on
May 7, 2021
Sold by
Richmond John and Saffan Kelly
Bought by
Richmond John and Richmond Kristi
Current Estimated Value
Home Financials for this Owner
Home Financials are based on the most recent Mortgage that was taken out on this home.
Original Mortgage
$282,000
Outstanding Balance
$255,562
Interest Rate
3.1%
Mortgage Type
New Conventional
Estimated Equity
$297,751
Purchase Details
Closed on
Sep 30, 2008
Sold by
Primacy Closing Corporation
Bought by
Richmond John and Staffan Kelly
Home Financials for this Owner
Home Financials are based on the most recent Mortgage that was taken out on this home.
Original Mortgage
$277,121
Interest Rate
6.43%
Mortgage Type
FHA
Purchase Details
Closed on
Jun 20, 2003
Sold by
Robinson Darnell and Robinson Vanessa L
Bought by
Ham Suk Jae and Bae Mi Kyung
Purchase Details
Closed on
Jan 14, 2003
Sold by
Robinson Darnell
Bought by
Ba Mortgage
Create a Home Valuation Report for This Property
The Home Valuation Report is an in-depth analysis detailing your home's value as well as a comparison with similar homes in the area
Home Values in the Area
Average Home Value in this Area
Purchase History
| Date | Buyer | Sale Price | Title Company |
|---|---|---|---|
| Richmond John | -- | First American Mortgage Sln | |
| Richmond John | $280,000 | None Available | |
| Primacy Closing Corporation | $265,800 | None Available | |
| Ham Suk Jae | $286,000 | Interstate Title | |
| Ba Mortgage | $221,539 | -- |
Source: Public Records
Mortgage History
| Date | Status | Borrower | Loan Amount |
|---|---|---|---|
| Open | Richmond John | $282,000 | |
| Closed | Richmond John | $277,121 |
Source: Public Records
Tax History Compared to Growth
Tax History
| Year | Tax Paid | Tax Assessment Tax Assessment Total Assessment is a certain percentage of the fair market value that is determined by local assessors to be the total taxable value of land and additions on the property. | Land | Improvement |
|---|---|---|---|---|
| 2022 | $2,313 | $191,950 | $0 | $0 |
| 2018 | $3,830 | $162,470 | $0 | $0 |
| 2017 | $3,756 | $162,440 | $0 | $0 |
| 2015 | -- | $149,930 | $0 | $0 |
| 2014 | -- | $132,220 | $0 | $0 |
| 2011 | -- | $106,490 | $0 | $0 |
Source: Public Records
Map
Nearby Homes
- 3879 Teakwood Ln
- 423 Silvervale Dr
- 3095 Bridgewater Rd Unit 30
- 3057 Bridgewater Rd
- 4444 Walton Blvd
- 753 Medinah Dr
- 3333 Walton Blvd
- 3634 Camden Ct
- 3399 Shimmons Rd
- 3640 Camden Ct
- 1102 Cobridge Dr
- 3111 Ramzi Ln
- 2638 Patrick Henry Rd
- 3890 Hillsdale Dr
- 3181 Rabeeh Dr
- 2526 Patrick Henry Rd
- 3101 Elstead St
- 2530 Patrick Henry St
- 3164 Bookham Cir
- 3160 Bookham Cir
- 325 Rose Brier Dr
- 347 Rose Brier Dr
- 340 Old Ridge Ct
- 355 Rose Brier Dr
- 315 Rose Brier Dr
- 344 Rose Brier Dr
- 328 Rose Brier Dr
- 336 Rose Brier Dr
- 354 Old Ridge Ct
- 3881 Williamsburg Ct
- 320 Rose Brier Dr Unit Bldg-Unit
- 320 Rose Brier Dr
- 365 Rose Brier Dr
- 3861 Williamsburg Ct
- 312 Rose Brier Dr
- 366 Old Ridge Ct
- 343 Antoinette Dr
- 331 Old Ridge Ct
- 3882 Williamsburg Ct
- 319 Old Ridge Ct