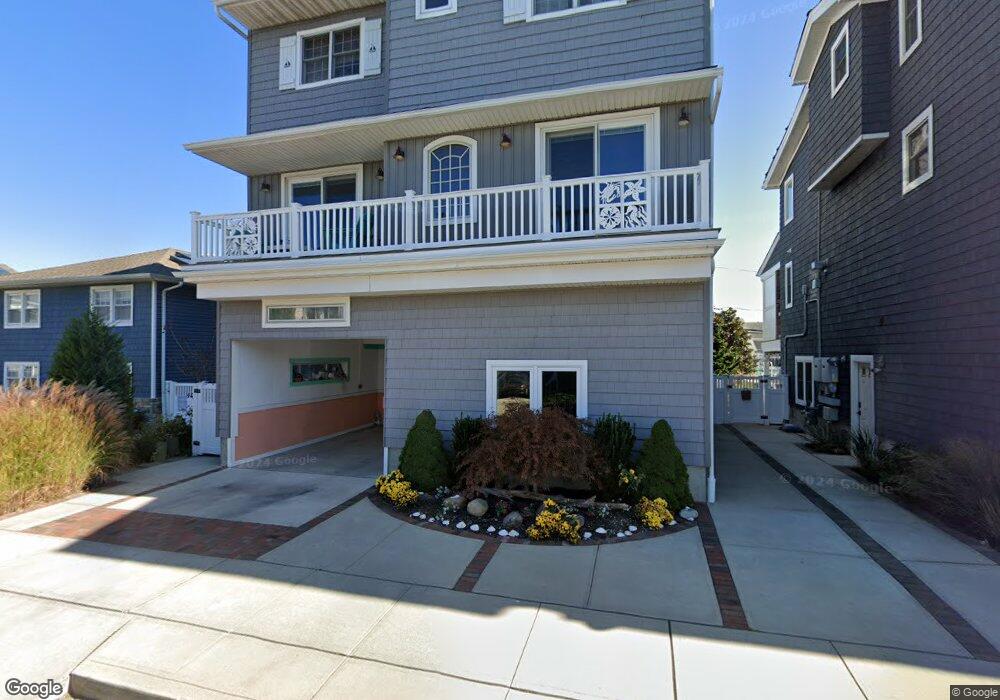
34 Curley St Long Beach, NY 11561
Estimated Value: $990,000 - $1,038,458
4
Beds
3
Baths
1,936
Sq Ft
$524/Sq Ft
Est. Value
About This Home
This home is located at 34 Curley St, Long Beach, NY 11561 and is currently estimated at $1,014,229, approximately $523 per square foot. 34 Curley St is a home located in Nassau County with nearby schools including Lido Elementary School, East Elementary School, and Lindell Elementary School.
Ownership History
Date
Name
Owned For
Owner Type
Purchase Details
Closed on
Oct 27, 2005
Sold by
Odery Susan
Bought by
Kempinski Stewart
Current Estimated Value
Purchase Details
Closed on
Jan 10, 2000
Sold by
Altman Michael J and Altman Mary E
Bought by
Odery Frank J and Odery Susan
Home Financials for this Owner
Home Financials are based on the most recent Mortgage that was taken out on this home.
Original Mortgage
$328,500
Interest Rate
8%
Mortgage Type
Purchase Money Mortgage
Create a Home Valuation Report for This Property
The Home Valuation Report is an in-depth analysis detailing your home's value as well as a comparison with similar homes in the area
Home Values in the Area
Average Home Value in this Area
Purchase History
| Date | Buyer | Sale Price | Title Company |
|---|---|---|---|
| Kempinski Stewart | $650,000 | -- | |
| Odery Frank J | $365,000 | Stewart Title Insurance Co |
Source: Public Records
Mortgage History
| Date | Status | Borrower | Loan Amount |
|---|---|---|---|
| Previous Owner | Odery Frank J | $328,500 |
Source: Public Records
Tax History Compared to Growth
Tax History
| Year | Tax Paid | Tax Assessment Tax Assessment Total Assessment is a certain percentage of the fair market value that is determined by local assessors to be the total taxable value of land and additions on the property. | Land | Improvement |
|---|---|---|---|---|
| 2025 | $9,250 | $724 | $405 | $319 |
| 2024 | $1,202 | $710 | $397 | $313 |
| 2023 | $8,514 | $724 | $405 | $319 |
| 2022 | $8,514 | $724 | $405 | $319 |
| 2021 | $18,525 | $729 | $221 | $508 |
| 2020 | $15,980 | $1,139 | $981 | $158 |
| 2019 | $9,845 | $1,072 | $981 | $91 |
| 2018 | $8,657 | $1,072 | $0 | $0 |
| 2017 | $6,296 | $1,072 | $981 | $91 |
| 2016 | $1,323 | $1,072 | $763 | $309 |
| 2015 | $1,316 | $1,072 | $763 | $309 |
| 2014 | $1,316 | $1,072 | $763 | $309 |
| 2013 | $1,617 | $1,378 | $981 | $397 |
Source: Public Records
Map
Nearby Homes