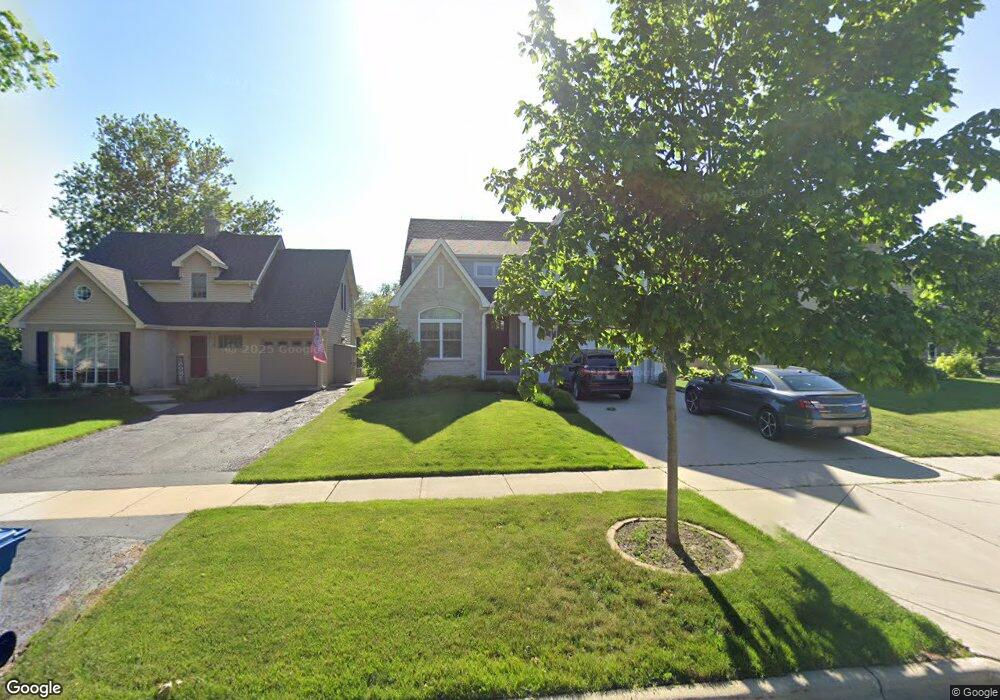
340 N Ridgeland Ave Elmhurst, IL 60126
Estimated Value: $1,138,000 - $1,470,000
4
Beds
5
Baths
3,636
Sq Ft
$352/Sq Ft
Est. Value
About This Home
This home is located at 340 N Ridgeland Ave, Elmhurst, IL 60126 and is currently estimated at $1,281,112, approximately $352 per square foot. 340 N Ridgeland Ave is a home located in DuPage County with nearby schools including Emerson Elementary School, Churchville Middle School, and York Community High School.
Ownership History
Date
Name
Owned For
Owner Type
Purchase Details
Closed on
Aug 12, 2010
Sold by
Integra Bank Na
Bought by
T E Mckenna Builders Inc
Current Estimated Value
Purchase Details
Closed on
Aug 12, 2009
Sold by
Conneely Builders Inc
Bought by
Integra Bank National Association
Purchase Details
Closed on
Oct 5, 2004
Sold by
Page Thomas M and Page Christina A
Bought by
Conneelly Builders Inc
Home Financials for this Owner
Home Financials are based on the most recent Mortgage that was taken out on this home.
Original Mortgage
$252,000
Interest Rate
5%
Mortgage Type
Purchase Money Mortgage
Purchase Details
Closed on
Jan 29, 1999
Sold by
Mcmanus Clementine V and Fields Doris E
Bought by
Page Thomas M and Page Christina A
Home Financials for this Owner
Home Financials are based on the most recent Mortgage that was taken out on this home.
Original Mortgage
$155,150
Interest Rate
6.81%
Create a Home Valuation Report for This Property
The Home Valuation Report is an in-depth analysis detailing your home's value as well as a comparison with similar homes in the area
Home Values in the Area
Average Home Value in this Area
Purchase History
| Date | Buyer | Sale Price | Title Company |
|---|---|---|---|
| T E Mckenna Builders Inc | $175,000 | Ctic | |
| Integra Bank National Association | -- | Ctic | |
| Conneelly Builders Inc | $315,000 | Multiple | |
| Page Thomas M | $163,500 | -- |
Source: Public Records
Mortgage History
| Date | Status | Borrower | Loan Amount |
|---|---|---|---|
| Previous Owner | Conneelly Builders Inc | $252,000 | |
| Previous Owner | Page Thomas M | $155,150 |
Source: Public Records
Tax History Compared to Growth
Tax History
| Year | Tax Paid | Tax Assessment Tax Assessment Total Assessment is a certain percentage of the fair market value that is determined by local assessors to be the total taxable value of land and additions on the property. | Land | Improvement |
|---|---|---|---|---|
| 2024 | $19,798 | $331,279 | $70,816 | $260,463 |
| 2023 | $18,302 | $304,540 | $65,100 | $239,440 |
| 2022 | $17,973 | $299,410 | $62,300 | $237,110 |
| 2021 | $17,222 | $286,790 | $59,670 | $227,120 |
| 2020 | $16,221 | $274,700 | $57,150 | $217,550 |
| 2019 | $16,071 | $264,130 | $54,950 | $209,180 |
| 2018 | $15,232 | $249,210 | $52,340 | $196,870 |
| 2017 | $14,953 | $238,180 | $50,020 | $188,160 |
| 2016 | $14,357 | $219,900 | $46,180 | $173,720 |
| 2015 | $14,109 | $203,140 | $42,660 | $160,480 |
| 2014 | $13,118 | $174,490 | $35,200 | $139,290 |
| 2013 | $13,055 | $178,050 | $35,920 | $142,130 |
Source: Public Records
Map
Nearby Homes
- 322 N Highland Ave
- 407 W North Ave
- 285 N Ridgeland Ave
- 284 N Highland Ave
- 412 N Ridgeland Ave
- 442 N Oak St
- 468 N Highland Ave
- 196 N Walnut St
- 456 N Elm Ave
- 120 N Walnut St
- 355 W 1st St
- 193 N Elm Ave
- 251 W Armitage Ave
- 104 Evergreen Ave
- 656 W Comstock Ave
- 262 N Addison Ave
- 655 W Comstock Ave
- 258 N Addison Ave
- 260 N Addison Ave
- 254 N Addison Ave
- 336 N Ridgeland Ave
- 428 W Grantley Ave
- 332 N Ridgeland Ave
- 330 N Ridgeland Ave
- 341 N Highview Ave
- 435 W Grantley Ave
- 345 N Highview Ave
- 337 N Highview Ave
- 324 N Ridgeland Ave
- 339 N Ridgeland Ave
- 343 N Ridgeland Ave
- 333 N Highview Ave
- 360 N Ridgeland Ave
- 320 N Ridgeland Ave
- 335 N Ridgeland Ave
- 329 N Highview Ave
- 355 N Highview Ave
- 331 N Ridgeland Ave
- 362 N Ridgeland Ave
- 325 N Ridgeland Ave