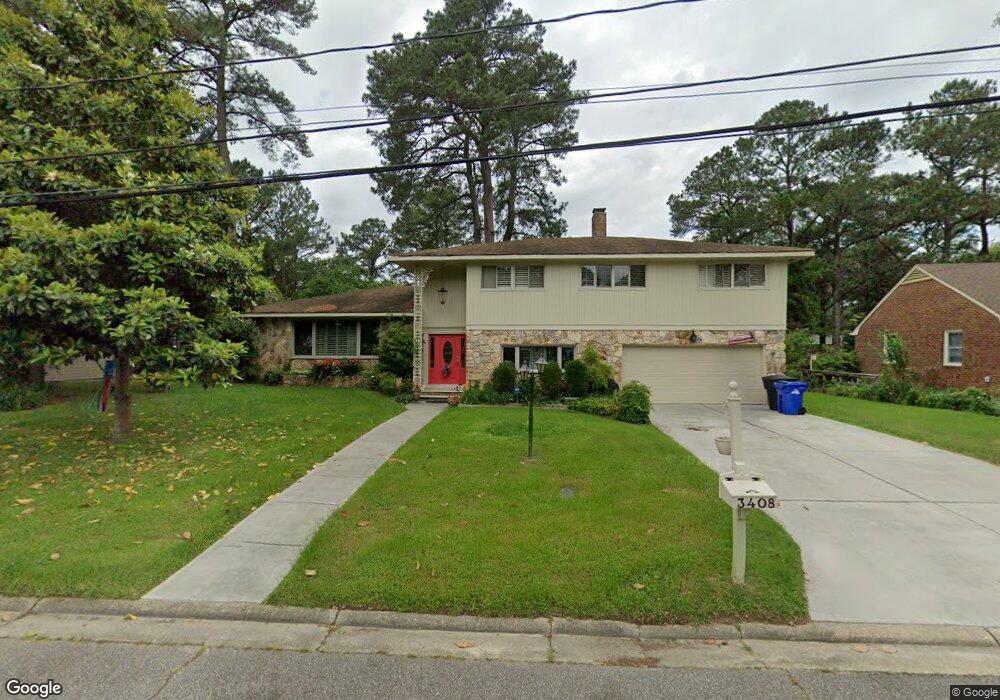
3408 Shoreline Dr Portsmouth, VA 23703
Churchland NeighborhoodEstimated Value: $415,000 - $470,395
3
Beds
3
Baths
2,833
Sq Ft
$157/Sq Ft
Est. Value
About This Home
This home is located at 3408 Shoreline Dr, Portsmouth, VA 23703 and is currently estimated at $444,849, approximately $157 per square foot. 3408 Shoreline Dr is a home located in Portsmouth City with nearby schools including Churchland Elementary School, Churchland Academy Elementary School, and Churchland Middle School.
Ownership History
Date
Name
Owned For
Owner Type
Purchase Details
Closed on
Feb 14, 2025
Sold by
Britt Linda Jean
Bought by
Huff Donald S and Huff Lisa V
Current Estimated Value
Home Financials for this Owner
Home Financials are based on the most recent Mortgage that was taken out on this home.
Original Mortgage
$223,334
Outstanding Balance
$221,483
Interest Rate
5.88%
Mortgage Type
FHA
Estimated Equity
$223,366
Purchase Details
Closed on
Oct 7, 2024
Sold by
Chupik Joanne D
Bought by
Huff Donald S and Britt Linda Jean
Home Financials for this Owner
Home Financials are based on the most recent Mortgage that was taken out on this home.
Original Mortgage
$270,000
Interest Rate
6.2%
Mortgage Type
New Conventional
Purchase Details
Closed on
Jun 25, 1999
Sold by
Strum Daniel G
Bought by
Chapik Jimmy A
Home Financials for this Owner
Home Financials are based on the most recent Mortgage that was taken out on this home.
Original Mortgage
$128,000
Interest Rate
7.09%
Create a Home Valuation Report for This Property
The Home Valuation Report is an in-depth analysis detailing your home's value as well as a comparison with similar homes in the area
Home Values in the Area
Average Home Value in this Area
Purchase History
| Date | Buyer | Sale Price | Title Company |
|---|---|---|---|
| Huff Donald S | $55,000 | Fidelity National Title | |
| Huff Donald S | $425,000 | Fidelity National Title | |
| Chapik Jimmy A | $160,000 | -- |
Source: Public Records
Mortgage History
| Date | Status | Borrower | Loan Amount |
|---|---|---|---|
| Open | Huff Donald S | $223,334 | |
| Previous Owner | Huff Donald S | $270,000 | |
| Previous Owner | Chapik Jimmy A | $128,000 |
Source: Public Records
Tax History Compared to Growth
Tax History
| Year | Tax Paid | Tax Assessment Tax Assessment Total Assessment is a certain percentage of the fair market value that is determined by local assessors to be the total taxable value of land and additions on the property. | Land | Improvement |
|---|---|---|---|---|
| 2025 | $5,153 | $424,040 | $101,010 | $323,030 |
| 2024 | $5,153 | $418,940 | $101,010 | $317,930 |
| 2023 | $5,200 | $402,280 | $101,010 | $301,270 |
| 2022 | $4,671 | $359,270 | $84,170 | $275,100 |
| 2021 | $4,171 | $320,810 | $64,750 | $256,060 |
| 2020 | $4,069 | $312,970 | $61,670 | $251,300 |
| 2019 | $3,914 | $301,080 | $61,670 | $239,410 |
| 2018 | $3,852 | $296,320 | $61,670 | $234,650 |
| 2017 | $3,852 | $296,320 | $61,670 | $234,650 |
| 2016 | $3,821 | $293,940 | $61,670 | $232,270 |
| 2015 | $3,821 | $293,940 | $61,670 | $232,270 |
| 2014 | $3,733 | $293,940 | $61,670 | $232,270 |
Source: Public Records
Map
Nearby Homes
- 3408 Wakefield Dr
- 4705 Templar Dr
- 4313 Templar Dr
- 4412 Carlton Ct
- 3405 Canterbury Dr
- 3200 Westwood Crescent
- 3613 Cardinal Ln
- 3425 Cedar Ln
- 4808 Thornwood St
- 3108 Whaley Rd
- 4707 High St W
- 2004 Sawgrass Ln
- 4417 Gannon Rd
- 3141 Riveredge Dr
- 4239 Hatton Point Ln Unit 35
- 5006 High St W
- 3509 Spence Rd
- 4517 Wake Forest Rd
- 4286 Hatton Point Ln
- 3609 Loon Ct
- 3404 Shoreline Dr
- 3500 Shoreline Dr
- 4513 Templar Dr
- 4509 Templar Dr
- 4537 Buckingham Dr
- 4517 Templar Dr
- 3400 Shoreline Dr
- 3504 Shoreline Dr
- 4505 Templar Dr
- 3501 Shoreline Dr
- 3401 Shoreline Dr
- 4521 Templar Dr
- 4533 Buckingham Dr
- 3308 Shoreline Dr
- 3508 Shoreline Dr
- 4504 Templar Dr
- 4501 Templar Dr
- 4542 Regent Dr
- 4528 Buckingham Dr
- 4500 Templar Dr