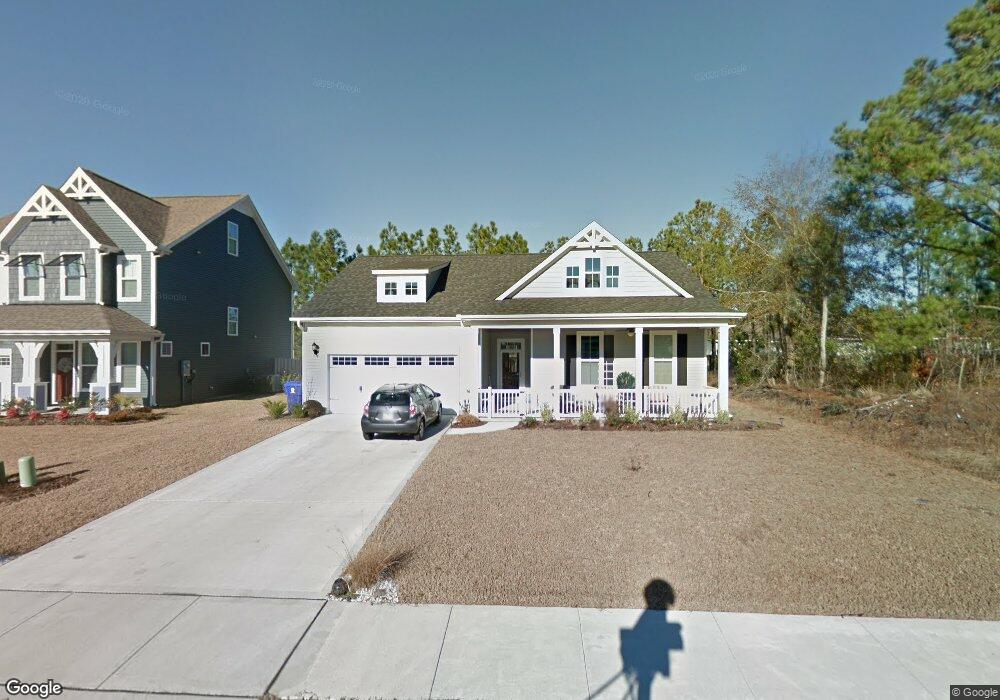
341 Belvedere Dr Holly Ridge, NC 28445
Estimated Value: $349,641 - $396,000
3
Beds
2
Baths
1,538
Sq Ft
$242/Sq Ft
Est. Value
About This Home
This home is located at 341 Belvedere Dr, Holly Ridge, NC 28445 and is currently estimated at $371,660, approximately $241 per square foot. 341 Belvedere Dr is a home located in Onslow County with nearby schools including Coastal Elementary, Dixon Elementary School, and Dixon High School.
Ownership History
Date
Name
Owned For
Owner Type
Purchase Details
Closed on
Dec 8, 2016
Sold by
Metcalf Susan E
Bought by
Goodman Jordan M
Current Estimated Value
Home Financials for this Owner
Home Financials are based on the most recent Mortgage that was taken out on this home.
Original Mortgage
$193,063
Outstanding Balance
$158,299
Interest Rate
4.03%
Mortgage Type
VA
Estimated Equity
$213,361
Purchase Details
Closed on
Jan 26, 2016
Sold by
Rae Catherine and Lopresto Linda
Bought by
Metcalf Robert F and Metcalf Susan E
Home Financials for this Owner
Home Financials are based on the most recent Mortgage that was taken out on this home.
Original Mortgage
$185,000
Interest Rate
3.98%
Mortgage Type
VA
Purchase Details
Closed on
Mar 11, 2013
Sold by
Robuck Homes Triangle Llc
Bought by
Rae Catherine and Lopresto Linda
Home Financials for this Owner
Home Financials are based on the most recent Mortgage that was taken out on this home.
Original Mortgage
$184,810
Interest Rate
3.59%
Mortgage Type
FHA
Create a Home Valuation Report for This Property
The Home Valuation Report is an in-depth analysis detailing your home's value as well as a comparison with similar homes in the area
Home Values in the Area
Average Home Value in this Area
Purchase History
| Date | Buyer | Sale Price | Title Company |
|---|---|---|---|
| Goodman Jordan M | $189,000 | Attorney | |
| Metcalf Robert F | $185,000 | Attorney | |
| Rae Catherine | $189,000 | None Available |
Source: Public Records
Mortgage History
| Date | Status | Borrower | Loan Amount |
|---|---|---|---|
| Open | Goodman Jordan M | $193,063 | |
| Previous Owner | Metcalf Robert F | $185,000 | |
| Previous Owner | Rae Catherine | $184,810 |
Source: Public Records
Tax History Compared to Growth
Tax History
| Year | Tax Paid | Tax Assessment Tax Assessment Total Assessment is a certain percentage of the fair market value that is determined by local assessors to be the total taxable value of land and additions on the property. | Land | Improvement |
|---|---|---|---|---|
| 2025 | $2,754 | $276,775 | $45,000 | $231,775 |
| 2024 | $2,754 | $276,775 | $45,000 | $231,775 |
| 2023 | $2,754 | $276,775 | $45,000 | $231,775 |
| 2022 | $2,782 | $276,775 | $45,000 | $231,775 |
| 2021 | $2,060 | $188,130 | $40,000 | $148,130 |
| 2020 | $2,060 | $188,130 | $40,000 | $148,130 |
| 2019 | $2,069 | $188,130 | $40,000 | $148,130 |
| 2018 | $2,088 | $188,130 | $40,000 | $148,130 |
| 2017 | $2,102 | $192,850 | $50,000 | $142,850 |
| 2016 | $2,102 | $192,850 | $0 | $0 |
| 2015 | $2,102 | $192,850 | $0 | $0 |
| 2014 | $2,102 | $192,850 | $0 | $0 |
Source: Public Records
Map
Nearby Homes
- 359 Belvedere Dr
- 110 Hampton Dr
- 333 Rose Bud Ln
- 1213 Daisy Ct
- 229 Red Carnation Dr
- 206 Holden Rd
- 435 Belvedere Dr
- 437 Belvedere Dr
- 807 Wildflower Dr
- 204 Red Carnation Dr
- 134 Merry Ln
- 17 Off
- 301 Log Cabin Way
- 202 Bungalow Rd
- 77 Sandy Ln
- 8 Hwy 50
- 767 E Ocean Rd
- 1001 Mabel Rawlinson Dr
- 156 Poplar Branch Way
- 129 Poplar Branch Way
- 341 Belvedere Dr
- 343 Belvedere Dr
- 339 Belvedere Dr
- 343 Belvedere Dr
- 345 Belvedere Dr
- 337 Belvedere Dr
- 345 Belvedere Dr
- 324 Belvedere Dr
- 326 Belvedere Dr
- 324 Belvedere Dr
- 347 Belvedere Dr
- 335 Belvedere Dr
- 328 Belvedere Dr
- 322 Belvedere Dr
- 330 Belvedere Dr
- 320 Belvedere Dr
- 320 Belvedere Dr
- 333 Belvedere Dr
- 349 Belvedere Dr
- 332 Belvedere Dr