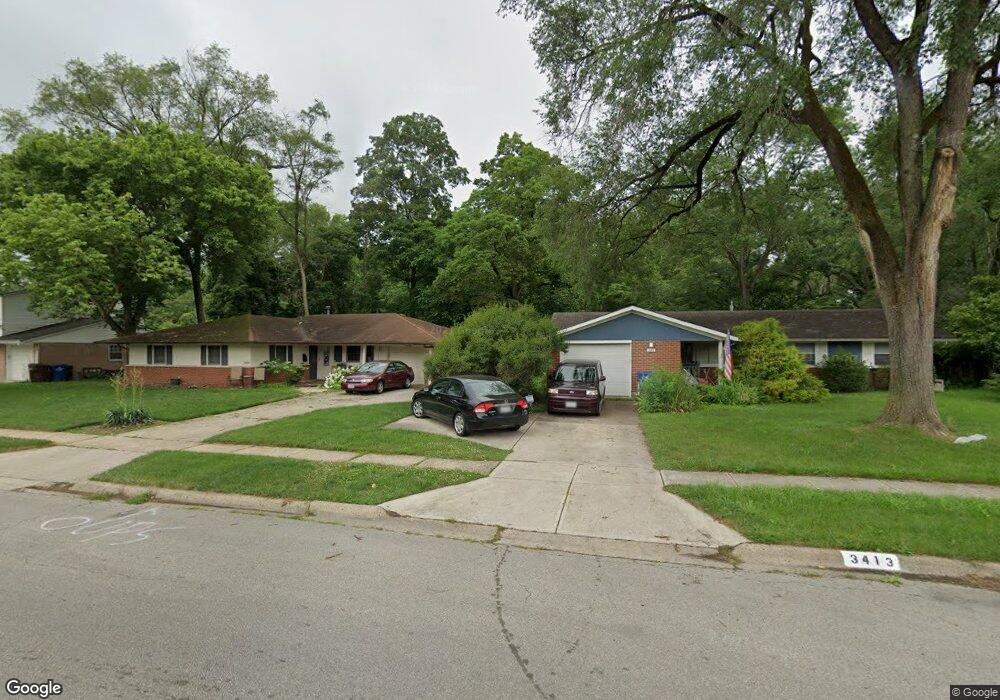
3413 Paris Blvd Westerville, OH 43081
Estimated Value: $287,944 - $309,000
3
Beds
2
Baths
1,325
Sq Ft
$226/Sq Ft
Est. Value
About This Home
This home is located at 3413 Paris Blvd, Westerville, OH 43081 and is currently estimated at $299,736, approximately $226 per square foot. 3413 Paris Blvd is a home located in Franklin County with nearby schools including Huber Ridge Elementary School, Walnut Springs Middle School, and Westerville Central High School.
Ownership History
Date
Name
Owned For
Owner Type
Purchase Details
Closed on
Dec 30, 2009
Sold by
Kresge Mark S
Bought by
Hearty Lauren M and Hearty Christopher P
Current Estimated Value
Home Financials for this Owner
Home Financials are based on the most recent Mortgage that was taken out on this home.
Original Mortgage
$131,572
Outstanding Balance
$84,391
Interest Rate
4.5%
Mortgage Type
FHA
Estimated Equity
$215,346
Purchase Details
Closed on
Nov 5, 2004
Sold by
Mckay Bonnie David and Mckay Jane Bonnie
Bought by
Kresge Mark S
Home Financials for this Owner
Home Financials are based on the most recent Mortgage that was taken out on this home.
Original Mortgage
$109,500
Interest Rate
5.91%
Mortgage Type
Purchase Money Mortgage
Purchase Details
Closed on
Apr 15, 2004
Sold by
Wimmer Bonnie M and Davis Bonnie M
Bought by
Jane Bonnie David Mckay and Jane Bonnie Sarah
Purchase Details
Closed on
Feb 17, 1987
Bought by
Davis Bonnie M
Create a Home Valuation Report for This Property
The Home Valuation Report is an in-depth analysis detailing your home's value as well as a comparison with similar homes in the area
Home Values in the Area
Average Home Value in this Area
Purchase History
| Date | Buyer | Sale Price | Title Company |
|---|---|---|---|
| Hearty Lauren M | $134,000 | Talon Group | |
| Kresge Mark S | $136,900 | Title First | |
| Jane Bonnie David Mckay | $91,500 | Title First Agency Inc | |
| Davis Bonnie M | -- | -- |
Source: Public Records
Mortgage History
| Date | Status | Borrower | Loan Amount |
|---|---|---|---|
| Open | Hearty Lauren M | $131,572 | |
| Closed | Kresge Mark S | $109,500 |
Source: Public Records
Tax History Compared to Growth
Tax History
| Year | Tax Paid | Tax Assessment Tax Assessment Total Assessment is a certain percentage of the fair market value that is determined by local assessors to be the total taxable value of land and additions on the property. | Land | Improvement |
|---|---|---|---|---|
| 2024 | $4,967 | $79,980 | $21,210 | $58,770 |
| 2023 | $4,861 | $79,975 | $21,210 | $58,765 |
| 2022 | $4,444 | $55,020 | $11,410 | $43,610 |
| 2021 | $4,509 | $55,020 | $11,410 | $43,610 |
| 2020 | $4,505 | $55,020 | $11,410 | $43,610 |
| 2019 | $3,741 | $41,830 | $11,410 | $30,420 |
| 2018 | $3,559 | $41,830 | $11,410 | $30,420 |
| 2017 | $3,678 | $41,830 | $11,410 | $30,420 |
| 2016 | $3,754 | $39,560 | $8,720 | $30,840 |
| 2015 | $3,524 | $39,560 | $8,720 | $30,840 |
| 2014 | $3,524 | $39,560 | $8,720 | $30,840 |
| 2013 | $1,731 | $39,550 | $8,715 | $30,835 |
Source: Public Records
Map
Nearby Homes
- 3474 Paris Blvd
- 3515 Paris Blvd
- 3535 Paris Blvd
- 5910 Cairo Rd
- 5550 Westerville Crossing Dr
- 6001 Cairo Rd
- 3551 Manila Dr
- 3564 Stockholm Rd
- 5563 Madrid Dr
- 5730 Crossing Ct Unit 1
- 5768-5770 Stormcroft Ave
- 3616 Stockholm Rd
- 3596 Manila Dr
- 3544 Madrid Dr
- 5660 Buenos Aires Blvd
- 3627 Manila Dr
- 5834 Stoneshead Ct
- 5577 Everest Way
- 5524 Buenos Aires Blvd
- 3682 Mexico Ave
- 3409 Paris Blvd
- 3419 Paris Blvd
- 3405 Paris Blvd
- 3425 Paris Blvd
- 3416 Paris Blvd
- 3408 Saigon Dr
- 3401 Paris Blvd
- 3429 Paris Blvd
- 3426 Paris Blvd
- 3422 Paris Blvd
- 3410 Saigon Dr
- 3425 Saigon Dr
- 3430 Paris Blvd
- 3391 Paris Blvd
- 3433 Paris Blvd
- 3437 Saigon Dr
- 3400 Paris Blvd
- 3434 Paris Blvd
- 3485 Vienna Ct
- 3420 Saigon Dr