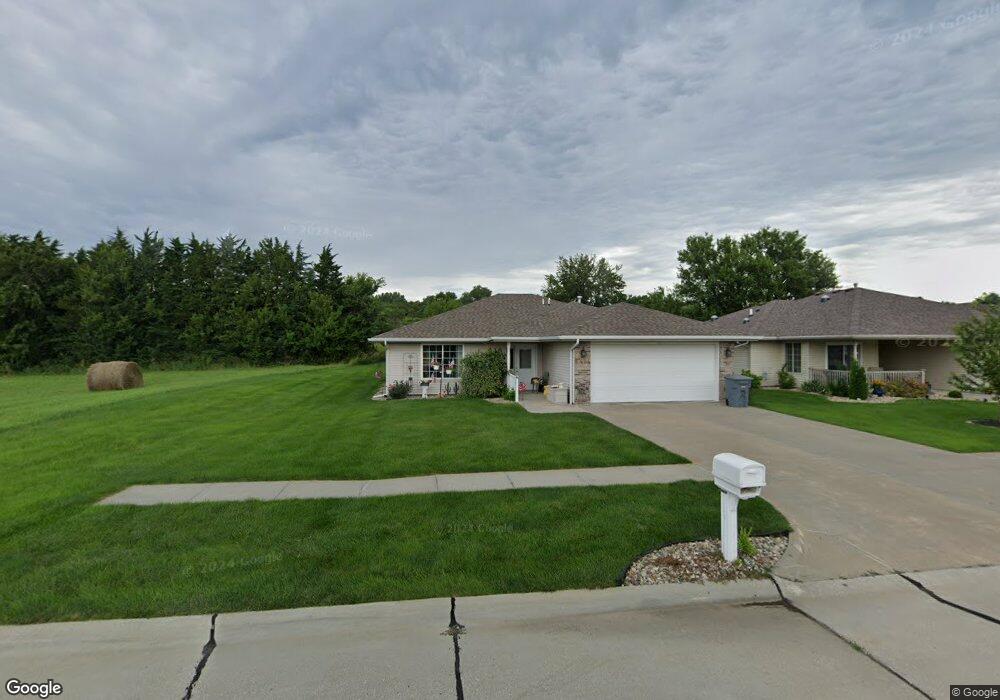
3414 Fox Ridge Ave Norfolk, NE 68701
Estimated Value: $287,000 - $349,000
2
Beds
2
Baths
1,466
Sq Ft
$213/Sq Ft
Est. Value
About This Home
This home is located at 3414 Fox Ridge Ave, Norfolk, NE 68701 and is currently estimated at $312,456, approximately $213 per square foot. 3414 Fox Ridge Ave is a home located in Madison County with nearby schools including Norfolk Senior High School, Norfolk Catholic School, and Sacred Heart Elementary School.
Ownership History
Date
Name
Owned For
Owner Type
Purchase Details
Closed on
Jul 5, 2013
Sold by
Strivens William C
Bought by
Steskal Jane C
Current Estimated Value
Home Financials for this Owner
Home Financials are based on the most recent Mortgage that was taken out on this home.
Original Mortgage
$128,000
Outstanding Balance
$61,979
Interest Rate
3.83%
Mortgage Type
Future Advance Clause Open End Mortgage
Estimated Equity
$250,477
Purchase Details
Closed on
Mar 6, 2008
Sold by
Strivens Trs Robert F and Strivens Verna J
Bought by
Strivens Tr Verna J
Purchase Details
Closed on
Nov 24, 2004
Sold by
Werner Kerry and Werner Barbara
Bought by
Strivens Trs Robert F and Strivens Verna J
Purchase Details
Closed on
May 18, 2004
Sold by
Mcintosh Family Llc
Bought by
Whitecliff Development Inc
Purchase Details
Closed on
Mar 25, 2004
Sold by
Carhart Lumber Co
Bought by
Werner Kerry and Werner Barbara
Create a Home Valuation Report for This Property
The Home Valuation Report is an in-depth analysis detailing your home's value as well as a comparison with similar homes in the area
Home Values in the Area
Average Home Value in this Area
Purchase History
| Date | Buyer | Sale Price | Title Company |
|---|---|---|---|
| Steskal Jane C | $161,000 | None Available | |
| Strivens Tr Verna J | -- | -- | |
| Strivens Verna J | -- | None Available | |
| Strivens Trs Robert F | $136,600 | -- | |
| Whitecliff Development Inc | $17,000 | Americna Title And Escrow Co | |
| Werner Kerry | $200,000 | -- |
Source: Public Records
Mortgage History
| Date | Status | Borrower | Loan Amount |
|---|---|---|---|
| Open | Steskal Jane C | $128,000 |
Source: Public Records
Tax History Compared to Growth
Tax History
| Year | Tax Paid | Tax Assessment Tax Assessment Total Assessment is a certain percentage of the fair market value that is determined by local assessors to be the total taxable value of land and additions on the property. | Land | Improvement |
|---|---|---|---|---|
| 2024 | $3,146 | $253,404 | $13,894 | $239,510 |
| 2023 | $4,319 | $233,628 | $13,894 | $219,734 |
| 2022 | $3,894 | $210,085 | $13,894 | $196,191 |
| 2021 | $3,587 | $193,886 | $13,894 | $179,992 |
| 2020 | $3,576 | $193,886 | $13,894 | $179,992 |
| 2019 | $3,449 | $180,553 | $13,894 | $166,659 |
| 2018 | $3,392 | $180,553 | $13,894 | $166,659 |
| 2017 | $3,060 | $162,697 | $13,894 | $148,803 |
| 2016 | $2,865 | $152,053 | $12,985 | $139,068 |
| 2015 | $2,866 | $152,053 | $12,985 | $139,068 |
| 2014 | $2,823 | $145,431 | $12,985 | $132,446 |
| 2013 | $2,741 | $136,766 | $12,985 | $123,781 |
Source: Public Records
Map
Nearby Homes
- 506 N 34th St
- 803 N 34th St
- 1201 N 34th St
- 1103 N 34th St
- 3403 Portia Place
- 3302 MacH 1 Dr
- 3605 MacH I Dr
- 3603 MacH I Dr
- 507 Valley Rd
- 3900 Madison Ave
- 1207 Parkhill Dr
- 1405 N 30th St
- 1407 N 30th St
- 2510 Westside Ave
- 1605 Eldorado Rd
- 2508 Westside Ave
- 3506 Bradford Ave
- 3406 Bradford Ave
- 2301 Random Rd
- 2604 W Cooper Dr**
- 3412 Fox Ridge Ave
- 3410 Fox Ridge Ave
- 3408 Fox Ridge Ave
- 3415 Fox Ridge Ave
- 3413 Fox Ridge Ave
- 3411 Fox Ridge Ave
- 3406 Fox Ridge Ave
- 3409 Fox Ridge Ave
- 3404 Fox Ridge Ave
- 600 N 37th St
- 3407 Fox Ridge Ave
- 3410 W Prospect Ave
- 3408 W Prospect Ave
- 3406 W Prospect Ave
- 3402 Fox Ridge Ave
- 3405 Fox Ridge Ave
- 411 N 34th St
- 3404 W Prospect Ave
- 3403 Fox Ridge Ave
- 3500 W Prospect Ave