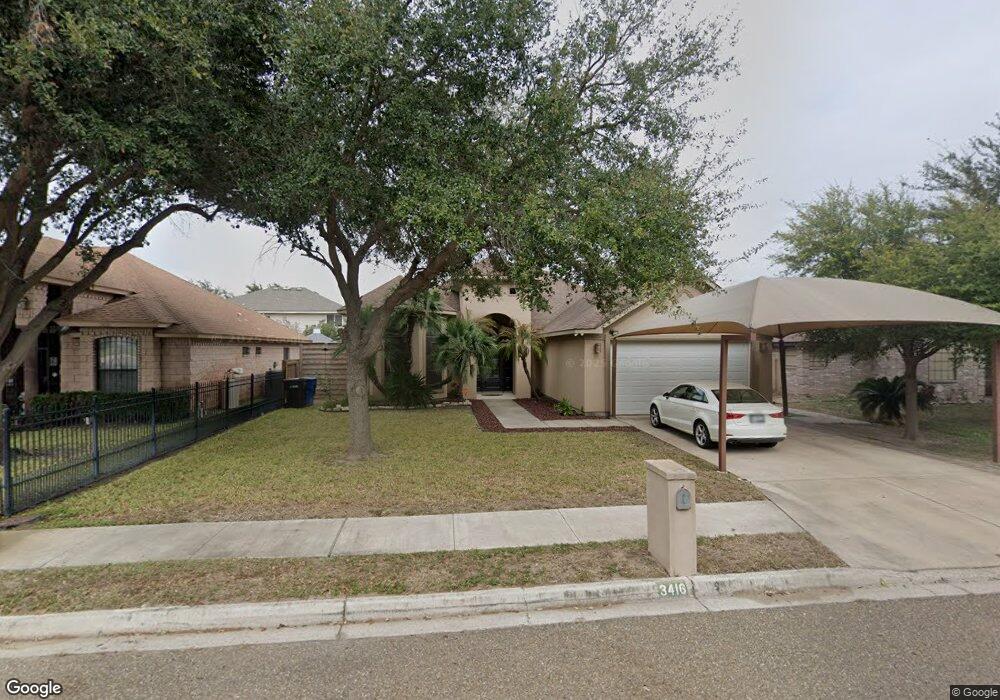
3416 Esperanza Ave McAllen, TX 78501
Estimated Value: $263,000 - $292,214
3
Beds
3
Baths
2,142
Sq Ft
$129/Sq Ft
Est. Value
About This Home
This home is located at 3416 Esperanza Ave, McAllen, TX 78501 and is currently estimated at $276,054, approximately $128 per square foot. 3416 Esperanza Ave is a home located in Hidalgo County with nearby schools including McAuliffe Elementary School, De Leon Middle School, and Rowe High School.
Ownership History
Date
Name
Owned For
Owner Type
Purchase Details
Closed on
Feb 19, 2025
Sold by
Dela Fuente Rafael
Bought by
Dela Fuente Krystal
Current Estimated Value
Purchase Details
Closed on
Mar 31, 2009
Sold by
Dela Fuente Roman and De La Fuente Maria
Bought by
Delafuente Rafael and Delafuente Krystal
Home Financials for this Owner
Home Financials are based on the most recent Mortgage that was taken out on this home.
Original Mortgage
$161,500
Interest Rate
5.24%
Mortgage Type
Purchase Money Mortgage
Purchase Details
Closed on
May 2, 2007
Sold by
Kingdom Rock Homes Inc
Bought by
Dela Fuente Roman
Home Financials for this Owner
Home Financials are based on the most recent Mortgage that was taken out on this home.
Original Mortgage
$161,500
Interest Rate
6.16%
Mortgage Type
Purchase Money Mortgage
Create a Home Valuation Report for This Property
The Home Valuation Report is an in-depth analysis detailing your home's value as well as a comparison with similar homes in the area
Home Values in the Area
Average Home Value in this Area
Purchase History
| Date | Buyer | Sale Price | Title Company |
|---|---|---|---|
| Dela Fuente Krystal | -- | None Listed On Document | |
| Delafuente Rafael | -- | None Available | |
| Dela Fuente Roman | -- | San Jacinto Title Services |
Source: Public Records
Mortgage History
| Date | Status | Borrower | Loan Amount |
|---|---|---|---|
| Previous Owner | Delafuente Rafael | $161,500 | |
| Previous Owner | Dela Fuente Roman | $161,500 |
Source: Public Records
Tax History Compared to Growth
Tax History
| Year | Tax Paid | Tax Assessment Tax Assessment Total Assessment is a certain percentage of the fair market value that is determined by local assessors to be the total taxable value of land and additions on the property. | Land | Improvement |
|---|---|---|---|---|
| 2025 | $4,800 | $272,011 | -- | -- |
| 2024 | $4,800 | $247,283 | -- | -- |
| 2023 | $5,289 | $224,803 | $0 | $0 |
| 2022 | $5,068 | $204,366 | $0 | $0 |
| 2021 | $4,746 | $185,787 | $39,168 | $148,217 |
| 2020 | $4,309 | $168,897 | $39,168 | $129,729 |
| 2019 | $4,178 | $164,714 | $39,168 | $125,546 |
| 2018 | $4,344 | $170,968 | $31,334 | $139,634 |
| 2017 | $4,073 | $159,668 | $31,334 | $128,334 |
| 2016 | $4,108 | $161,063 | $31,334 | $129,729 |
| 2015 | $3,642 | $162,458 | $31,334 | $131,124 |
Source: Public Records
Map
Nearby Homes
- 3408 Dianthus Ave
- 3517 Daffodil Ave
- 3205 N 36th St
- 3013 N 33rd St
- 3001 N Ware Rd
- 3301 N 33rd St
- 2804 N Ware Rd
- 2904 N 34th St
- 3504 Harvey St
- 2813 N 32nd St
- 4000 W Daffodil Ave
- 3606 N 34th Ln
- 3501 N 39th St
- 3700 Westway Ave
- 3713 Westway Ave
- Paloma Plan at Harvest Coves
- San Luis Plan at Harvest Coves
- Iris Plan at Harvest Coves
- Bahia Plan at Harvest Coves
- Marigold Plan at Harvest Coves
- 3412 Esperanza Ave
- 3412 Esperanza Ave
- 3420 Esperanza Ave
- 3417 Fern Ave
- 3413 Fern Ave
- 3421 Fern Ave
- 3408 Esperanza Ave
- 3417 Esperanza Ave
- 3409 Fern Ave
- 3413 Esperanza Ave
- 3421 Esperanza Ave
- 3404 Esperanza Ave
- 3409 Esperanza Ave
- 3105 N 36th St
- 3101 N 36th St
- 3109 N 36th St
- 3405 Fern Ave
- 3021 N 36th St
- 3113 N 36th St
- 3405 Esperanza Ave