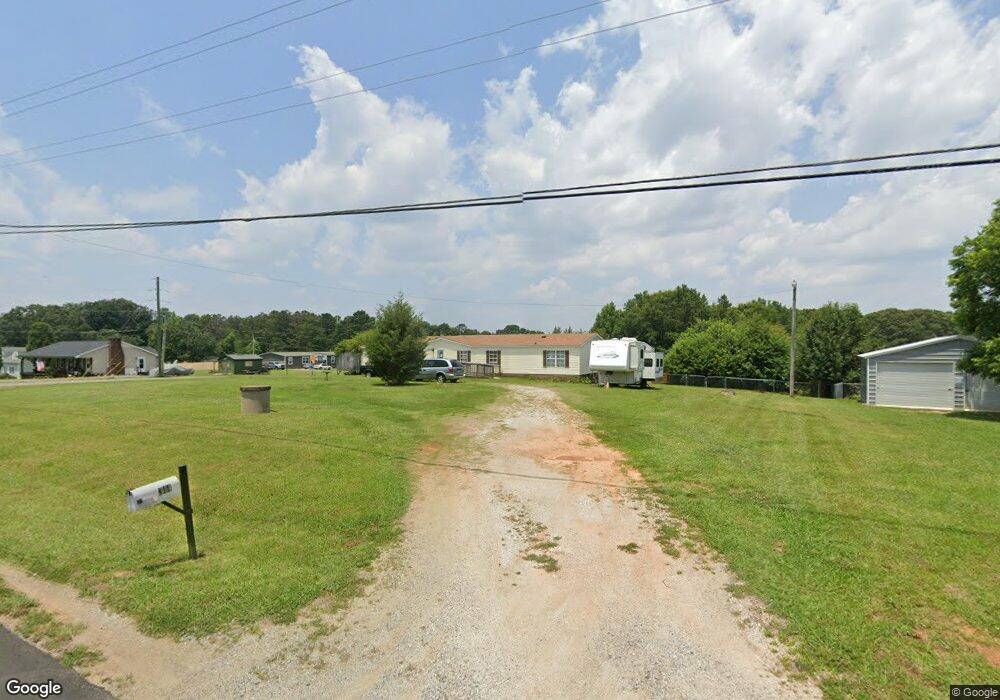
342 Goforth Rd Kings Mountain, NC 28086
Estimated Value: $274,000 - $347,000
--
Bed
--
Bath
2,079
Sq Ft
$148/Sq Ft
Est. Value
About This Home
This home is located at 342 Goforth Rd, Kings Mountain, NC 28086 and is currently estimated at $308,264, approximately $148 per square foot. 342 Goforth Rd is a home with nearby schools including North Elementary School, Kings Mountain Middle, and Kings Mountain Intermediate School.
Ownership History
Date
Name
Owned For
Owner Type
Purchase Details
Closed on
Jan 29, 2020
Sold by
Cmh Homes Inc
Bought by
Lindner Richard C and Lindner Linda A
Current Estimated Value
Home Financials for this Owner
Home Financials are based on the most recent Mortgage that was taken out on this home.
Original Mortgage
$158,440
Outstanding Balance
$140,553
Interest Rate
3.7%
Mortgage Type
VA
Estimated Equity
$167,711
Purchase Details
Closed on
Nov 14, 2019
Sold by
Edwards Donzie and Edwards Twila
Bought by
Cmh Homes Inc
Purchase Details
Closed on
Aug 19, 2008
Sold by
Scism Bruce T and Scism Martha
Bought by
Edwards Donzie and Edwards Twila
Purchase Details
Closed on
Mar 22, 2007
Sold by
American Genaral Financial Services Inc
Bought by
Seism Bruce T and Seism Martha
Purchase Details
Closed on
Sep 28, 2006
Sold by
Mcdaniel Robert W and Mcdaniel Tonia R
Bought by
American General Financial Services Inc
Create a Home Valuation Report for This Property
The Home Valuation Report is an in-depth analysis detailing your home's value as well as a comparison with similar homes in the area
Home Values in the Area
Average Home Value in this Area
Purchase History
| Date | Buyer | Sale Price | Title Company |
|---|---|---|---|
| Lindner Richard C | $158,500 | None Available | |
| Cmh Homes Inc | $30,000 | None Available | |
| Edwards Donzie | $20,000 | None Available | |
| Seism Bruce T | $27,000 | None Available | |
| American General Financial Services Inc | $31,652 | None Available |
Source: Public Records
Mortgage History
| Date | Status | Borrower | Loan Amount |
|---|---|---|---|
| Open | Lindner Richard C | $158,440 |
Source: Public Records
Tax History Compared to Growth
Tax History
| Year | Tax Paid | Tax Assessment Tax Assessment Total Assessment is a certain percentage of the fair market value that is determined by local assessors to be the total taxable value of land and additions on the property. | Land | Improvement |
|---|---|---|---|---|
| 2025 | $1,347 | $212,174 | $40,443 | $171,731 |
| 2024 | $1,153 | $141,901 | $31,811 | $110,090 |
| 2023 | $1,153 | $141,901 | $31,811 | $110,090 |
| 2022 | $1,147 | $141,901 | $31,811 | $110,090 |
| 2021 | $1,153 | $141,901 | $31,811 | $110,090 |
| 2020 | $219 | $26,502 | $24,002 | $2,500 |
| 2019 | $219 | $26,502 | $24,002 | $2,500 |
| 2018 | $219 | $26,502 | $24,002 | $2,500 |
| 2017 | $218 | $26,502 | $24,002 | $2,500 |
| 2016 | $209 | $26,502 | $24,002 | $2,500 |
| 2015 | $165 | $20,872 | $20,872 | $0 |
| 2014 | $165 | $20,872 | $20,872 | $0 |
Source: Public Records
Map
Nearby Homes
- 608 Rollingbrook Rd
- 124 Rollingbrook Rd
- 213 Press Sweezy Rd
- 331 Oak Grove Rd Unit 7
- 103 Amy Dr
- 123 Gold Run Ct
- 101 Long Meadows Dr
- 1575 Lewis Farm Rd
- 106 Kelly Marie
- 215 J Robinson Pkwy
- 155 Castle Ct
- 105 Gold Run Ct
- 000 Putnam Lake Rd
- 100 Tripp Dr
- 3367 Marshall Wolfe Rd
- 839 Oak Grove Rd
- 104 Ole Farm Place
- 1521 N Piedmont Ave
- 00 Gary Beam Rd
- 5212 Timber Creek Ct
- 344 Goforth Rd
- 334 Goforth Rd
- 404 Goforth Rd
- 111 Green Meadows Dr
- 406 Goforth Rd Unit 1
- 113 Green Meadows Dr
- 329 Goforth Rd
- 116 Green Meadows Dr
- 326 Goforth Rd
- 419 Goforth Rd
- 416 Goforth Rd
- 117 Green Meadows Dr
- 327 Goforth Rd
- 415 Goforth Rd
- 115 Kevin Dr
- 322 Goforth Rd
- 114 Kevin Dr
- 30 Open Ln
- 123 Green Meadows Dr
- 323 Goforth Rd