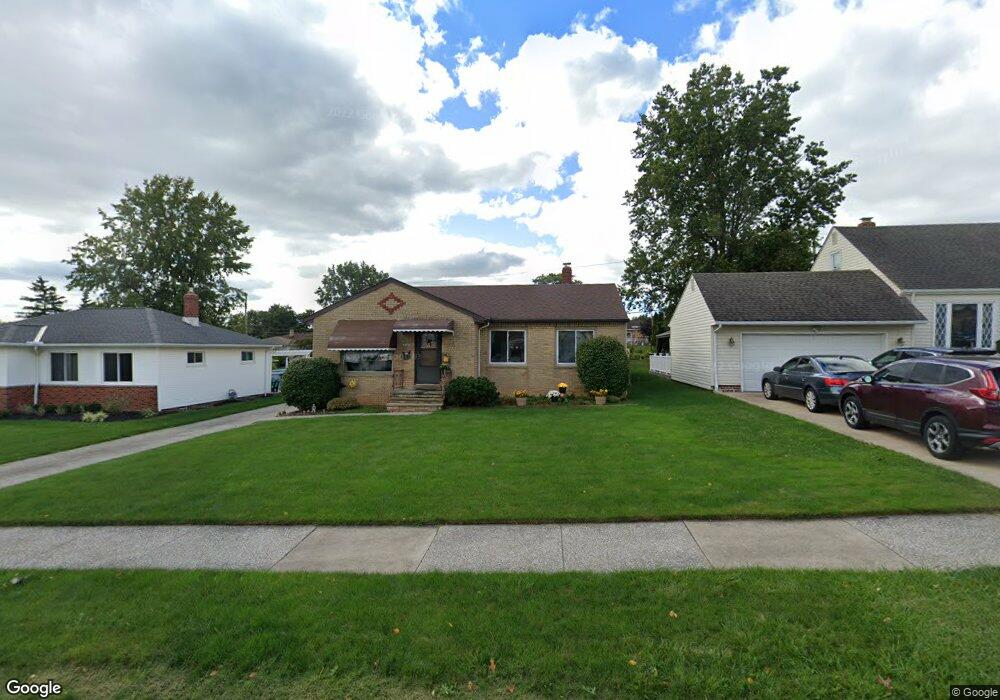
3423 Hilltop Dr Cleveland, OH 44134
Estimated Value: $171,000 - $254,000
3
Beds
1
Bath
1,068
Sq Ft
$193/Sq Ft
Est. Value
About This Home
This home is located at 3423 Hilltop Dr, Cleveland, OH 44134 and is currently estimated at $205,947, approximately $192 per square foot. 3423 Hilltop Dr is a home located in Cuyahoga County with nearby schools including Dentzler Elementary School, Normandy High School, and Hillside Middle School.
Ownership History
Date
Name
Owned For
Owner Type
Purchase Details
Closed on
Jun 4, 2021
Sold by
Turk Patricia A and Ford Frances V
Bought by
Druso James H and Druso Roberta
Current Estimated Value
Home Financials for this Owner
Home Financials are based on the most recent Mortgage that was taken out on this home.
Original Mortgage
$112,100
Outstanding Balance
$101,493
Interest Rate
2.9%
Mortgage Type
New Conventional
Estimated Equity
$104,454
Purchase Details
Closed on
Jun 22, 2016
Sold by
Ford Jospeh E and Ford Frances V
Bought by
Turk Patricia A and Ford Frances V
Purchase Details
Closed on
Jun 14, 2016
Sold by
Turk Patricia A and Ford Frances V
Bought by
Turk Patricia A and Ford Frances V
Purchase Details
Closed on
Mar 29, 1985
Sold by
Turk Frank J and Turk Leona
Bought by
Turk Frank J and Turk Leona
Purchase Details
Closed on
Jan 1, 1975
Bought by
Turk Frank J and Turk Leona
Create a Home Valuation Report for This Property
The Home Valuation Report is an in-depth analysis detailing your home's value as well as a comparison with similar homes in the area
Home Values in the Area
Average Home Value in this Area
Purchase History
| Date | Buyer | Sale Price | Title Company |
|---|---|---|---|
| Druso James H | $118,000 | City Title Agency | |
| Turk Patricia A | -- | City Title Agency | |
| Turk Patricia A | -- | City Title Company | |
| Turk Patricia A | -- | Attorney | |
| Turk Frank J | -- | -- | |
| Turk Frank J | -- | -- |
Source: Public Records
Mortgage History
| Date | Status | Borrower | Loan Amount |
|---|---|---|---|
| Open | Druso James H | $112,100 |
Source: Public Records
Tax History Compared to Growth
Tax History
| Year | Tax Paid | Tax Assessment Tax Assessment Total Assessment is a certain percentage of the fair market value that is determined by local assessors to be the total taxable value of land and additions on the property. | Land | Improvement |
|---|---|---|---|---|
| 2024 | $3,354 | $52,325 | $13,475 | $38,850 |
| 2023 | $3,292 | $44,840 | $11,100 | $33,740 |
| 2022 | $3,263 | $44,840 | $11,100 | $33,740 |
| 2021 | $3,359 | $44,840 | $11,100 | $33,740 |
| 2020 | $3,184 | $37,660 | $9,310 | $28,350 |
| 2019 | $3,058 | $107,600 | $26,600 | $81,000 |
| 2018 | $1,539 | $37,660 | $9,310 | $28,350 |
| 2017 | $3,073 | $35,210 | $8,120 | $27,090 |
| 2016 | $3,055 | $35,210 | $8,120 | $27,090 |
| 2015 | $2,906 | $35,210 | $8,120 | $27,090 |
| 2014 | $2,981 | $36,300 | $8,370 | $27,930 |
Source: Public Records
Map
Nearby Homes
- 3610 Jeanne Dr
- 7030 Lyle Ave
- 3262 Marda Dr
- 3195 Marda Dr
- 3200 Dentzler Rd
- 3711 Klusner Ave
- 3807 Klusner Ave
- 3011 Klusner Ave
- 2838 Marda Dr
- 7180 Marko Ln
- 3018 Center Dr
- 3430 Park Dr
- 2644 Nottingham Dr
- 2406 Park Dr
- 2410 Park Dr
- 4803 Sassafras Dr
- 0 Orchard Park Dr
- 4402 Stary Dr
- 4001 W Ridgewood Dr
- 4601 W Ridgewood Dr
- 3403 Hilltop Dr
- 3443 Hilltop Dr
- 3383 Hilltop Dr
- 3463 Hilltop Dr
- 3410 Jeanne Dr
- 3430 Jeanne Dr
- 3400 Jeanne Dr
- 3483 Hilltop Dr
- 3363 Hilltop Dr
- 3420 Hilltop Dr
- 3450 Jeanne Dr
- 3380 Jeanne Dr
- 3400 Hilltop Dr
- 3440 Hilltop Dr
- 3380 Hilltop Dr
- 3460 Hilltop Dr
- 3470 Jeanne Dr
- 3360 Jeanne Dr
- 3493 Hilltop Dr
- 3343 Hilltop Dr