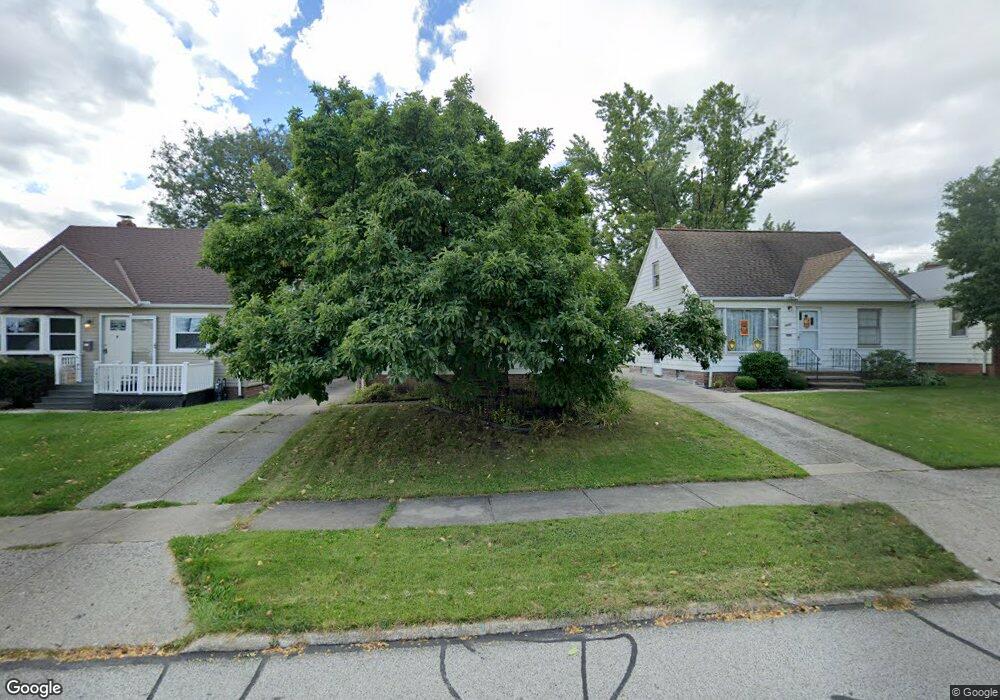
3427 Stanfield Dr Cleveland, OH 44134
Estimated Value: $192,421 - $220,000
2
Beds
1
Bath
1,111
Sq Ft
$186/Sq Ft
Est. Value
About This Home
This home is located at 3427 Stanfield Dr, Cleveland, OH 44134 and is currently estimated at $206,355, approximately $185 per square foot. 3427 Stanfield Dr is a home located in Cuyahoga County with nearby schools including Dentzler Elementary School, Normandy High School, and Hillside Middle School.
Ownership History
Date
Name
Owned For
Owner Type
Purchase Details
Closed on
Jun 23, 2001
Sold by
Harvey Nancy
Bought by
Lombardo Derick
Current Estimated Value
Purchase Details
Closed on
Dec 13, 2000
Sold by
Scharschmidt Steven T
Bought by
Lombardo Derick and Harvey Nancy
Home Financials for this Owner
Home Financials are based on the most recent Mortgage that was taken out on this home.
Original Mortgage
$109,944
Interest Rate
7.8%
Mortgage Type
FHA
Purchase Details
Closed on
Jan 6, 1999
Sold by
Scharschmidt Steven T
Bought by
Scharschmidt Steven T and Scharschmidt Collette M
Purchase Details
Closed on
Apr 15, 1994
Sold by
Scharschmidt Paul A
Bought by
Scharschmidt Steven T
Purchase Details
Closed on
Apr 13, 1994
Sold by
Scharschmidt Steven T
Bought by
Scharschmidt Paul A
Purchase Details
Closed on
Mar 17, 1994
Sold by
Scharschmidt Paul A and M J
Bought by
Scharschmidt Steven T
Purchase Details
Closed on
Jan 1, 1975
Bought by
Scharschmidt Paul A and M J
Create a Home Valuation Report for This Property
The Home Valuation Report is an in-depth analysis detailing your home's value as well as a comparison with similar homes in the area
Home Values in the Area
Average Home Value in this Area
Purchase History
| Date | Buyer | Sale Price | Title Company |
|---|---|---|---|
| Lombardo Derick | $45,100 | -- | |
| Lombardo Derick | $110,000 | -- | |
| Scharschmidt Steven T | -- | -- | |
| Scharschmidt Steven T | $80,000 | -- | |
| Scharschmidt Paul A | -- | -- | |
| Scharschmidt Steven T | -- | -- | |
| Scharschmidt Paul A | -- | -- |
Source: Public Records
Mortgage History
| Date | Status | Borrower | Loan Amount |
|---|---|---|---|
| Previous Owner | Lombardo Derick | $109,944 |
Source: Public Records
Tax History Compared to Growth
Tax History
| Year | Tax Paid | Tax Assessment Tax Assessment Total Assessment is a certain percentage of the fair market value that is determined by local assessors to be the total taxable value of land and additions on the property. | Land | Improvement |
|---|---|---|---|---|
| 2024 | $3,454 | $56,665 | $10,885 | $45,780 |
| 2023 | $3,132 | $44,170 | $8,750 | $35,420 |
| 2022 | $3,103 | $44,170 | $8,750 | $35,420 |
| 2021 | $3,192 | $44,170 | $8,750 | $35,420 |
| 2020 | $3,025 | $37,100 | $7,350 | $29,750 |
| 2019 | $2,899 | $106,000 | $21,000 | $85,000 |
| 2018 | $2,817 | $37,100 | $7,350 | $29,750 |
| 2017 | $2,882 | $34,270 | $6,130 | $28,140 |
| 2016 | $2,864 | $34,270 | $6,130 | $28,140 |
| 2015 | $2,786 | $34,270 | $6,130 | $28,140 |
| 2014 | $2,786 | $35,320 | $6,300 | $29,020 |
Source: Public Records
Map
Nearby Homes
- 3711 Klusner Ave
- 7030 Lyle Ave
- 3807 Klusner Ave
- 3262 Marda Dr
- 3430 Park Dr
- 3011 Klusner Ave
- 3018 Center Dr
- 3195 Marda Dr
- 3610 Jeanne Dr
- 2838 Marda Dr
- 3200 Dentzler Rd
- 7180 Marko Ln
- 2410 Park Dr
- 2406 Park Dr
- 0 Orchard Park Dr
- 4001 W Ridgewood Dr
- 4601 W Ridgewood Dr
- 2644 Nottingham Dr
- 6480 State Rd Unit F10
- 5208 Orchard Park Dr
- 3431 Stanfield Dr
- 3423 Stanfield Dr
- 3419 Stanfield Dr
- 3435 Stanfield Dr
- 3415 Stanfield Dr
- 3426 Klusner Ave
- 3422 Klusner Ave
- 3430 Klusner Ave
- 3418 Klusner Ave
- 3411 Stanfield Dr
- 3503 Stanfield Dr
- 3414 Klusner Ave
- 3426 Stanfield Dr
- 3422 Stanfield Dr
- 3430 Stanfield Dr
- 3434 Stanfield Dr
- 3418 Stanfield Dr
- 3407 Stanfield Dr
- 3410 Klusner Ave
- 3502 Klusner Ave