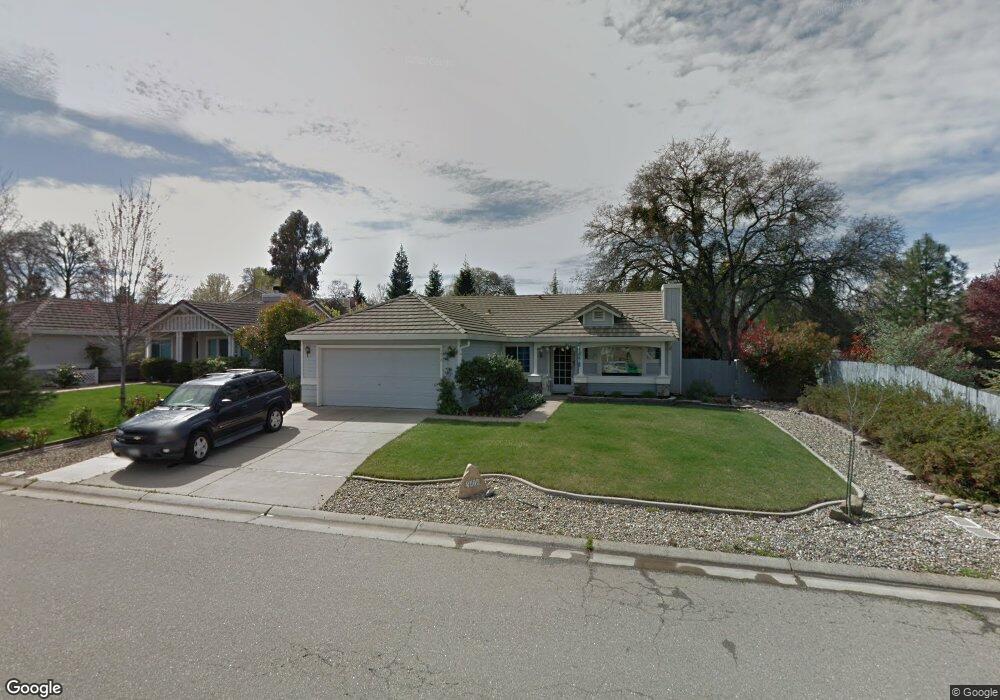
3428 Tea Rose Dr El Dorado Hills, CA 95762
Estimated Value: $641,426 - $686,000
4
Beds
2
Baths
1,500
Sq Ft
$439/Sq Ft
Est. Value
About This Home
This home is located at 3428 Tea Rose Dr, El Dorado Hills, CA 95762 and is currently estimated at $658,607, approximately $439 per square foot. 3428 Tea Rose Dr is a home located in El Dorado County with nearby schools including Green Valley Elementary School, Pleasant Grove Middle School, and Ponderosa High School.
Ownership History
Date
Name
Owned For
Owner Type
Purchase Details
Closed on
Dec 16, 2021
Sold by
Rouleau John L and Rouleau Merie L
Bought by
Carey Brooke and Carey Kyle
Current Estimated Value
Home Financials for this Owner
Home Financials are based on the most recent Mortgage that was taken out on this home.
Original Mortgage
$380,000
Outstanding Balance
$349,500
Interest Rate
3.11%
Mortgage Type
New Conventional
Estimated Equity
$309,107
Purchase Details
Closed on
Oct 24, 2001
Sold by
Jones Christopher A and Jones Melissa L
Bought by
Rouleau John L and Rouleau Merle L
Purchase Details
Closed on
Nov 12, 1998
Sold by
Stoebe Robert E and Stoebe Regina M
Bought by
Jones Christopher A and Jones Melissa L
Home Financials for this Owner
Home Financials are based on the most recent Mortgage that was taken out on this home.
Original Mortgage
$168,750
Interest Rate
6.54%
Create a Home Valuation Report for This Property
The Home Valuation Report is an in-depth analysis detailing your home's value as well as a comparison with similar homes in the area
Home Values in the Area
Average Home Value in this Area
Purchase History
| Date | Buyer | Sale Price | Title Company |
|---|---|---|---|
| Carey Brooke | $400,000 | Fidelity Natl Ttl Co Of Ca | |
| Rouleau John L | $248,000 | Chicago Title Co | |
| Jones Christopher A | $174,000 | Old Republic Title Company |
Source: Public Records
Mortgage History
| Date | Status | Borrower | Loan Amount |
|---|---|---|---|
| Open | Carey Brooke | $380,000 | |
| Previous Owner | Jones Christopher A | $168,750 |
Source: Public Records
Tax History Compared to Growth
Tax History
| Year | Tax Paid | Tax Assessment Tax Assessment Total Assessment is a certain percentage of the fair market value that is determined by local assessors to be the total taxable value of land and additions on the property. | Land | Improvement |
|---|---|---|---|---|
| 2025 | $6,394 | $583,663 | $186,772 | $396,891 |
| 2024 | $6,394 | $572,219 | $183,110 | $389,109 |
| 2023 | $5,998 | $561,000 | $179,520 | $381,480 |
| 2022 | $3,743 | $345,211 | $97,434 | $247,777 |
| 2021 | $3,998 | $338,443 | $95,524 | $242,919 |
| 2020 | $3,746 | $334,974 | $94,545 | $240,429 |
| 2019 | $3,687 | $328,407 | $92,692 | $235,715 |
| 2018 | $3,578 | $321,969 | $90,875 | $231,094 |
| 2017 | $3,525 | $315,657 | $89,094 | $226,563 |
| 2016 | $3,478 | $309,469 | $87,348 | $222,121 |
| 2015 | $3,365 | $304,823 | $86,037 | $218,786 |
| 2014 | $3,365 | $298,853 | $84,352 | $214,501 |
Source: Public Records
Map
Nearby Homes
- 4004 Prairie Falcon Dr
- 423 Oeste Ln
- 4066 Plateau Cir
- 3021 Robles Ct
- 3182 Birmingham Way
- 7111 Cinnamon Teal Way
- 3180 Woodleigh Ln
- 5505 Crimson Ct
- 7137 Cinnamon Teal Way
- 5510 Crimson Ct
- 1247 Senegal Way
- 0 Wilkinson Rd
- 0 Wilkinson Rd
- 7020 Talmage Ct
- 3341 Rancho Tierra Ct
- 2871 Vista Verde Dr
- 2980 Calido Ct
- 2780 Hillcrest Dr
- 2940 Pasada Rd
- 3039 Estepa Dr Unit 6E
- 3436 Tea Rose Dr
- 5080 Klondike Way
- 5074 Klondike Way
- 5161 Camanche Way
- 3442 Tea Rose Dr
- 5068 Klondike Way
- 3429 Tea Rose Dr
- 3435 Tea Rose Dr
- 5155 Camanche Way
- 3425 Tea Rose Dr
- 3441 Tea Rose Dr
- 5060 Klondike Way
- 3419 Tea Rose Dr
- 3445 Tea Rose Dr
- 5151 Camanche Way
- 3408 Tea Rose Dr
- 5056 Klondike Way
- 3456 Tea Rose Dr
- 3451 Tea Rose Dr
- 5069 Klondike Way