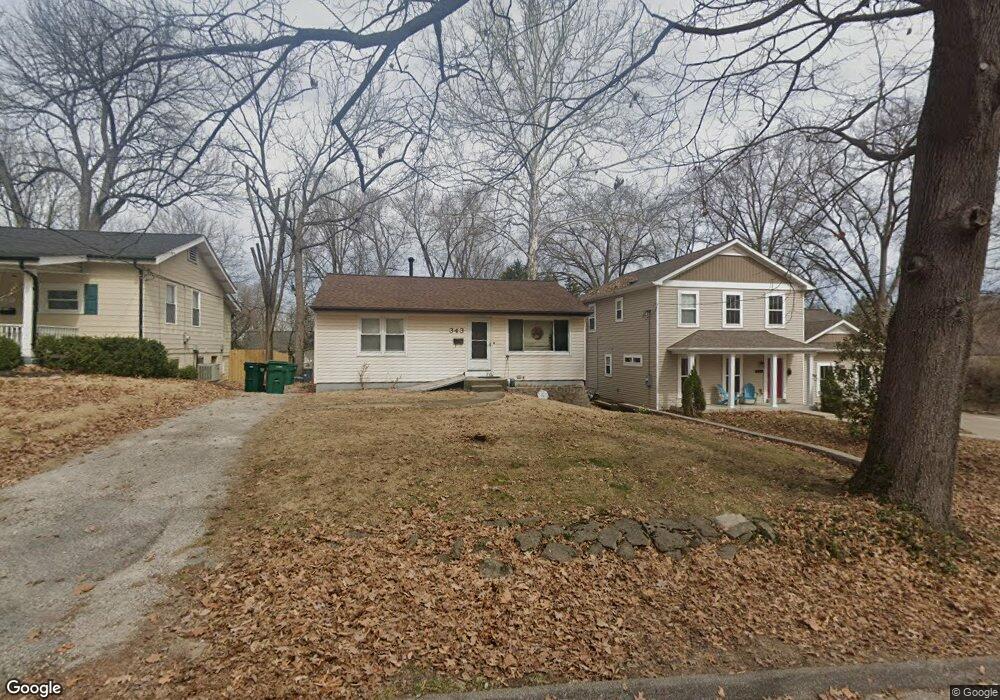
343 Clark Ave Saint Louis, MO 63119
Estimated Value: $264,253 - $283,000
2
Beds
2
Baths
825
Sq Ft
$329/Sq Ft
Est. Value
About This Home
This home is located at 343 Clark Ave, Saint Louis, MO 63119 and is currently estimated at $271,313, approximately $328 per square foot. 343 Clark Ave is a home located in St. Louis County with nearby schools including Avery Elementary School, Hixson Middle School, and Webster Groves High School.
Ownership History
Date
Name
Owned For
Owner Type
Purchase Details
Closed on
Feb 6, 2009
Sold by
Byerly Dawn L and Gardner Dawn L
Bought by
Gardner Dawn L and Gardner Steven A
Current Estimated Value
Home Financials for this Owner
Home Financials are based on the most recent Mortgage that was taken out on this home.
Original Mortgage
$74,000
Interest Rate
4.91%
Mortgage Type
New Conventional
Purchase Details
Closed on
Jan 30, 2003
Sold by
White J Kevin
Bought by
Byerly Dawn L
Home Financials for this Owner
Home Financials are based on the most recent Mortgage that was taken out on this home.
Original Mortgage
$91,000
Interest Rate
5.84%
Purchase Details
Closed on
Jul 25, 1997
Sold by
Graves Michael Shawn and Graves Diane C
Bought by
White J Kevin
Home Financials for this Owner
Home Financials are based on the most recent Mortgage that was taken out on this home.
Original Mortgage
$79,920
Interest Rate
7.6%
Mortgage Type
FHA
Create a Home Valuation Report for This Property
The Home Valuation Report is an in-depth analysis detailing your home's value as well as a comparison with similar homes in the area
Home Values in the Area
Average Home Value in this Area
Purchase History
| Date | Buyer | Sale Price | Title Company |
|---|---|---|---|
| Gardner Dawn L | -- | Investors Title Company | |
| Byerly Dawn L | $114,000 | -- | |
| White J Kevin | -- | -- |
Source: Public Records
Mortgage History
| Date | Status | Borrower | Loan Amount |
|---|---|---|---|
| Closed | Gardner Dawn L | $74,000 | |
| Closed | Byerly Dawn L | $91,000 | |
| Previous Owner | White J Kevin | $79,920 |
Source: Public Records
Tax History Compared to Growth
Tax History
| Year | Tax Paid | Tax Assessment Tax Assessment Total Assessment is a certain percentage of the fair market value that is determined by local assessors to be the total taxable value of land and additions on the property. | Land | Improvement |
|---|---|---|---|---|
| 2025 | $3,177 | $47,710 | $41,590 | $6,120 |
| 2024 | $3,177 | $45,370 | $30,250 | $15,120 |
| 2023 | $3,177 | $45,370 | $30,250 | $15,120 |
| 2022 | $3,006 | $40,020 | $30,250 | $9,770 |
| 2021 | $2,995 | $40,020 | $30,250 | $9,770 |
| 2020 | $3,020 | $37,600 | $30,250 | $7,350 |
| 2019 | $2,999 | $37,600 | $30,250 | $7,350 |
| 2018 | $2,544 | $28,240 | $21,190 | $7,050 |
| 2017 | $2,527 | $28,240 | $21,190 | $7,050 |
| 2016 | $2,330 | $24,930 | $18,150 | $6,780 |
| 2015 | $2,333 | $24,930 | $18,150 | $6,780 |
| 2014 | $2,216 | $23,030 | $13,020 | $10,010 |
Source: Public Records
Map
Nearby Homes
- 610 Cornelia Ave
- 814 Holland Ave
- 546 Holland Ave
- 619 N Bompart Ave
- 441 Park Rd
- 827 Cornell Ave
- 2911 Brazeau Ave
- 617 N Elm Ave
- 112 Oakwood Ave
- 716 Clark Ave
- 2904 Collier Ave
- 8908 W Pendleton Ave
- 2829 Brazeau Ave
- 1013 Bell Ave
- 400 Marion Ave
- 544 Summit Ave
- 808 Greeley Ave
- 901 Ennis Ave
- 8724 Magdalen Ave
- 840 Marshall Ave
- 337 Clark Ave
- 353 Clark Ave
- 333 Clark Ave
- 340 Atalanta Ave
- 336 Atalanta Ave
- 329 Clark Ave
- 344 Atalanta Ave
- 332 Atalanta Ave
- 350 Atalanta Ave
- 350 Clark Ave
- 328 Atalanta Ave
- 354 Atalanta Ave
- 321 Clark Ave
- 334 Clark Ave
- 324 Atalanta Ave
- 328 Clark Ave
- 320 Atalanta Ave
- 315 Clark Ave
- 316 Atalanta Ave
- 322 Clark Ave