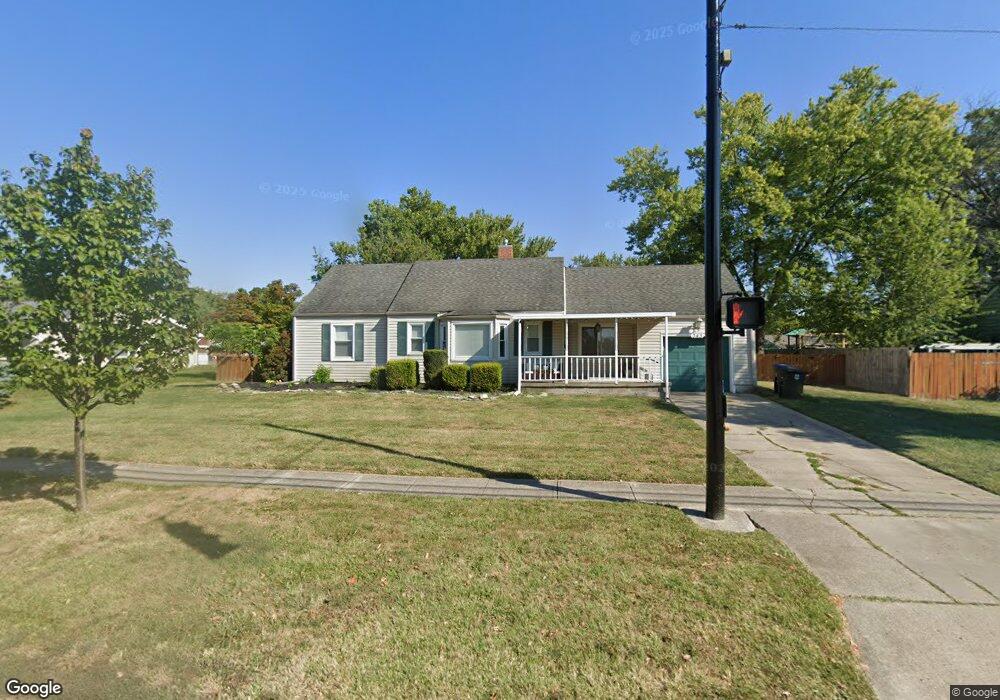
343 E Franklin St Dayton, OH 45459
Estimated Value: $178,000 - $207,745
3
Beds
2
Baths
1,103
Sq Ft
$172/Sq Ft
Est. Value
About This Home
This home is located at 343 E Franklin St, Dayton, OH 45459 and is currently estimated at $189,686, approximately $171 per square foot. 343 E Franklin St is a home located in Montgomery County with nearby schools including Primary Village North, Stingley Elementary School, and Tower Heights Middle School.
Ownership History
Date
Name
Owned For
Owner Type
Purchase Details
Closed on
Jun 29, 2017
Sold by
Patterson Janet L
Bought by
Hurst Michael A and Hurst Tawnya Lee
Current Estimated Value
Home Financials for this Owner
Home Financials are based on the most recent Mortgage that was taken out on this home.
Original Mortgage
$65,625
Interest Rate
3.95%
Mortgage Type
Future Advance Clause Open End Mortgage
Purchase Details
Closed on
Dec 29, 2011
Sold by
Patterson Janet L
Bought by
Patterson Janet L and Janet Patterson Trust
Purchase Details
Closed on
May 26, 1999
Sold by
Aller Pamela J
Bought by
Patterson Turner B and Patterson Janet L
Home Financials for this Owner
Home Financials are based on the most recent Mortgage that was taken out on this home.
Original Mortgage
$61,500
Interest Rate
7.25%
Create a Home Valuation Report for This Property
The Home Valuation Report is an in-depth analysis detailing your home's value as well as a comparison with similar homes in the area
Home Values in the Area
Average Home Value in this Area
Purchase History
| Date | Buyer | Sale Price | Title Company |
|---|---|---|---|
| Hurst Michael A | $87,500 | Sterling Title Inc | |
| Patterson Janet L | -- | Attorney | |
| Patterson Turner B | $76,900 | -- |
Source: Public Records
Mortgage History
| Date | Status | Borrower | Loan Amount |
|---|---|---|---|
| Closed | Hurst Michael A | $65,625 | |
| Closed | Patterson Turner B | $61,500 | |
| Closed | Patterson Turner B | $15,375 |
Source: Public Records
Tax History Compared to Growth
Tax History
| Year | Tax Paid | Tax Assessment Tax Assessment Total Assessment is a certain percentage of the fair market value that is determined by local assessors to be the total taxable value of land and additions on the property. | Land | Improvement |
|---|---|---|---|---|
| 2024 | $2,357 | $39,510 | $15,800 | $23,710 |
| 2023 | $2,357 | $39,510 | $15,800 | $23,710 |
| 2022 | $2,304 | $30,630 | $12,250 | $18,380 |
| 2021 | $2,373 | $30,630 | $12,250 | $18,380 |
| 2020 | $2,307 | $30,630 | $12,250 | $18,380 |
| 2019 | $2,582 | $30,630 | $12,250 | $18,380 |
| 2018 | $2,296 | $30,630 | $12,250 | $18,380 |
| 2017 | $2,686 | $36,270 | $12,250 | $24,020 |
| 2016 | $2,978 | $37,980 | $12,250 | $25,730 |
| 2015 | $2,948 | $37,980 | $12,250 | $25,730 |
| 2014 | $2,948 | $37,980 | $12,250 | $25,730 |
| 2012 | -- | $34,880 | $14,000 | $20,880 |
Source: Public Records
Map
Nearby Homes
- 121 Woodfield Place
- 40 Cemetery Dr
- 129 Bradstreet Rd
- 311 Pleasant Hill Dr
- 7820 Raintree Rd
- 7395 Cades Cove Unit 174174
- 271 Maple Ave
- 85 Poinciana Dr
- 59 Wythe Parish St Unit 4
- 170 S Main St Unit C
- 51 Winchester (#E) Place
- 7312 Caribou Trail Unit 55
- 7215 Whitetail Trail Unit 108108
- 1271 Forest Walk Dr
- 17 Westerly Ln Unit 17
- 99 Davis Rd
- 7308 Tamarind Trail
- 7128 Hartcrest Ln Unit 130
- 7128 Hartcrest Ln Unit 130130
- 7129 Fallen Oak Trace Unit 839
- 333 E Franklin St
- 353 E Franklin St
- 140 Southlake Dr
- 130 Southlake Dr
- 359 E Franklin St
- 146 Southlake Dr
- 323 E Franklin St
- 120 Southlake Dr
- 2123 Lake Glen Ct
- 2125 Lake Glen Ct
- 313 E Franklin St
- 110 Southlake Dr
- 125 Southlake Dr
- 2110 Lake Glen Ct
- 2140 Lake Glen Ct Unit 2140
- 2140 Lake Glen Ct Unit 2140
- 2140 Lake Glen Ct Unit 2140
- 2140 Lake Glen Ct Unit 2140
- 2140 Lake Glen Ct Unit 2140
- 2140 Lake Glen Ct Unit 2140