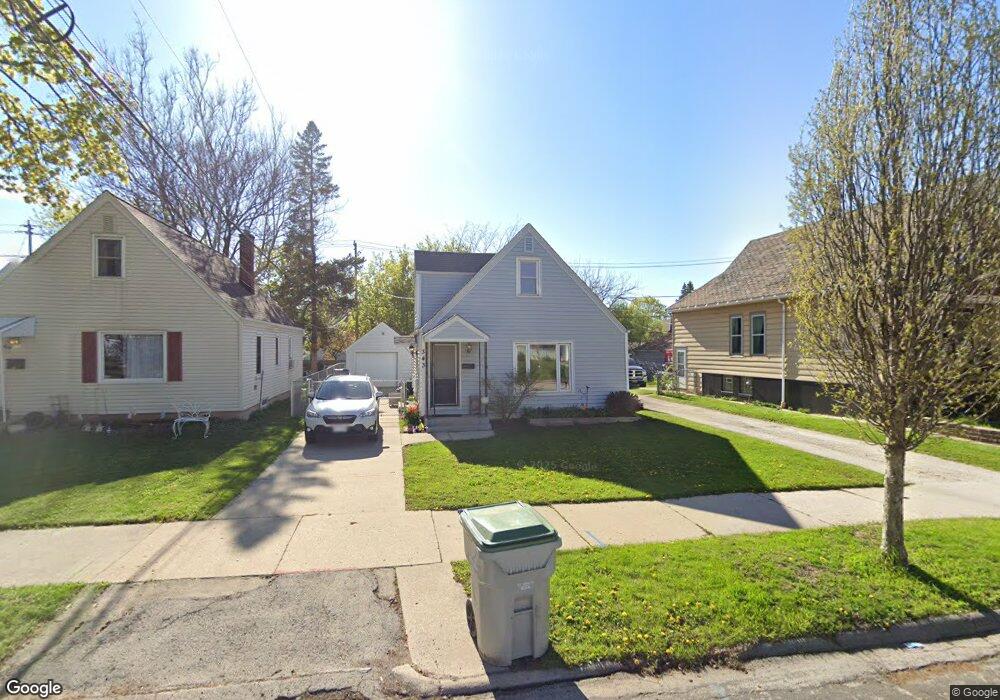
343 N 62nd St Milwaukee, WI 53213
Bluemound Heights NeighborhoodEstimated Value: $183,000 - $222,000
3
Beds
1
Bath
1,030
Sq Ft
$204/Sq Ft
Est. Value
About This Home
This home is located at 343 N 62nd St, Milwaukee, WI 53213 and is currently estimated at $210,582, approximately $204 per square foot. 343 N 62nd St is a home located in Milwaukee County with nearby schools including Milwaukee Spanish Immersion School - Upper Campus, Milwaukee German Immersion School, and Craig Montessori School.
Ownership History
Date
Name
Owned For
Owner Type
Purchase Details
Closed on
Oct 1, 2016
Sold by
Hoogerhyde Sarah L and Dee Brema C
Bought by
Hoogerhyde Sarah L
Current Estimated Value
Purchase Details
Closed on
Oct 16, 2014
Sold by
Fannie Mae
Bought by
Hoogerhyde Sarah L and Dee Brenna C
Home Financials for this Owner
Home Financials are based on the most recent Mortgage that was taken out on this home.
Original Mortgage
$70,775
Outstanding Balance
$54,219
Interest Rate
4.08%
Mortgage Type
New Conventional
Estimated Equity
$156,363
Purchase Details
Closed on
Oct 21, 2013
Sold by
Valance Marsha J
Bought by
Federal National Mortgage Association
Purchase Details
Closed on
Jul 21, 1999
Sold by
Schmidbauer Gary R and Schmidbauer Christine A
Bought by
Valance Marsha J
Home Financials for this Owner
Home Financials are based on the most recent Mortgage that was taken out on this home.
Original Mortgage
$79,200
Interest Rate
7.7%
Mortgage Type
Purchase Money Mortgage
Create a Home Valuation Report for This Property
The Home Valuation Report is an in-depth analysis detailing your home's value as well as a comparison with similar homes in the area
Home Values in the Area
Average Home Value in this Area
Purchase History
| Date | Buyer | Sale Price | Title Company |
|---|---|---|---|
| Hoogerhyde Sarah L | -- | None Available | |
| Hoogerhyde Sarah L | -- | None Available | |
| Federal National Mortgage Association | $90,700 | -- | |
| Valance Marsha J | $88,000 | -- |
Source: Public Records
Mortgage History
| Date | Status | Borrower | Loan Amount |
|---|---|---|---|
| Open | Hoogerhyde Sarah L | $70,775 | |
| Previous Owner | Valance Marsha J | $79,200 |
Source: Public Records
Tax History Compared to Growth
Tax History
| Year | Tax Paid | Tax Assessment Tax Assessment Total Assessment is a certain percentage of the fair market value that is determined by local assessors to be the total taxable value of land and additions on the property. | Land | Improvement |
|---|---|---|---|---|
| 2024 | $3,191 | $155,200 | $19,200 | $136,000 |
| 2023 | $2,956 | $125,100 | $19,200 | $105,900 |
| 2022 | $2,663 | $125,100 | $19,200 | $105,900 |
| 2021 | $2,609 | $111,300 | $20,400 | $90,900 |
| 2020 | $2,654 | $111,300 | $20,400 | $90,900 |
| 2019 | $2,246 | $104,000 | $13,700 | $90,300 |
| 2018 | $2,461 | $104,000 | $13,700 | $90,300 |
| 2017 | $2,516 | $99,600 | $10,000 | $89,600 |
| 2016 | $2,618 | $98,800 | $10,000 | $88,800 |
| 2015 | $2,678 | $95,000 | $10,000 | $85,000 |
| 2014 | $3,012 | $90,800 | $10,000 | $80,800 |
| 2013 | -- | $90,800 | $10,000 | $80,800 |
Source: Public Records
Map
Nearby Homes
- 6105 W Saint Paul Ave
- 416 N 64th St
- 528 N 62nd St
- 530 N 61st St
- 6042 W Stevenson St
- 6118 W Wisconsin Ave Unit 20
- 165 N 66th St
- 603 N Hawley Rd
- 161 S 62nd St
- 170 S 64th St
- 603 N 54th St
- 176 N 69th St
- 403 N 69th St
- 536 N 54th St
- 5818 W Valley Forge Dr
- 7003 W Mount Vernon Ave
- 209 N 70th St
- 147 N 70th St
- 5211 W Wisconsin Ave Unit 5217
- 6650 Hillside Ln
- 351 N 62nd St
- 337 N 62nd St
- 357 N 62nd St Unit 359
- 335 N 62nd St
- 346 N 63rd St
- 361 N 62nd St Unit 363
- 331 N 62nd St
- 328 N 62nd St
- 350 N 63rd St
- 340 N 63rd St
- 6133 W Saint Paul Ave
- 356 N 63rd St
- 336 N 63rd St
- 401 N 62nd St
- 325 N 62nd St
- 360 N 63rd St
- 334 N 63rd St
- 6125 W Saint Paul Ave
- 340 N 62nd St
- 404 N 63rd St