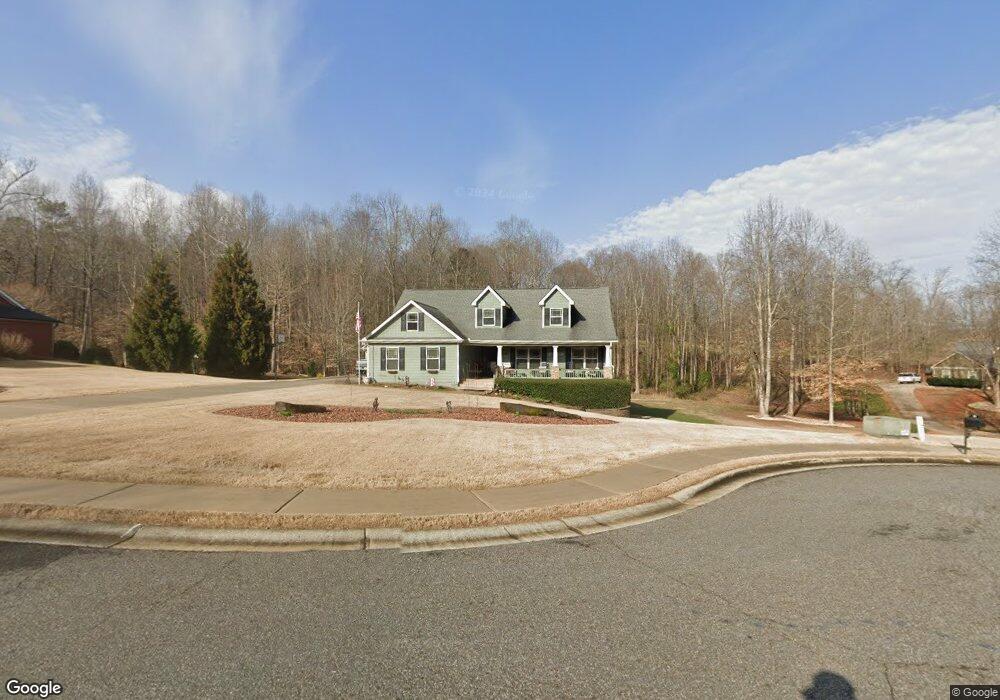
343 Raven Ridge Jefferson, GA 30549
Estimated Value: $448,927 - $590,000
3
Beds
3
Baths
2,226
Sq Ft
$230/Sq Ft
Est. Value
About This Home
This home is located at 343 Raven Ridge, Jefferson, GA 30549 and is currently estimated at $512,482, approximately $230 per square foot. 343 Raven Ridge is a home located in Jackson County with nearby schools including South Jackson Elementary School, East Jackson Middle School, and East Jackson Comprehensive High School.
Ownership History
Date
Name
Owned For
Owner Type
Purchase Details
Closed on
Jan 2, 2013
Sold by
Nolan Phillip S
Bought by
Nolan Philip S and Nolan Bonnie J
Current Estimated Value
Home Financials for this Owner
Home Financials are based on the most recent Mortgage that was taken out on this home.
Original Mortgage
$183,708
Outstanding Balance
$129,979
Interest Rate
3.75%
Mortgage Type
FHA
Estimated Equity
$382,503
Purchase Details
Closed on
Oct 23, 2006
Sold by
Not Provided
Bought by
Nolan Phillip S and Nolan Bonnie J
Home Financials for this Owner
Home Financials are based on the most recent Mortgage that was taken out on this home.
Original Mortgage
$203,000
Interest Rate
6.31%
Mortgage Type
FHA
Purchase Details
Closed on
Oct 18, 2005
Sold by
Jackson Trail Development Inc
Bought by
Rackley Construction Inc
Create a Home Valuation Report for This Property
The Home Valuation Report is an in-depth analysis detailing your home's value as well as a comparison with similar homes in the area
Home Values in the Area
Average Home Value in this Area
Purchase History
| Date | Buyer | Sale Price | Title Company |
|---|---|---|---|
| Nolan Philip S | -- | -- | |
| Nolan Phillip S | $254,300 | -- | |
| Rackley Construction Inc | $43,800 | -- |
Source: Public Records
Mortgage History
| Date | Status | Borrower | Loan Amount |
|---|---|---|---|
| Open | Nolan Philip S | $183,708 | |
| Previous Owner | Nolan Phillip S | $203,000 |
Source: Public Records
Tax History Compared to Growth
Tax History
| Year | Tax Paid | Tax Assessment Tax Assessment Total Assessment is a certain percentage of the fair market value that is determined by local assessors to be the total taxable value of land and additions on the property. | Land | Improvement |
|---|---|---|---|---|
| 2024 | $2,195 | $170,400 | $20,000 | $150,400 |
| 2023 | $3,621 | $154,320 | $20,000 | $134,320 |
| 2022 | $3,029 | $134,240 | $20,000 | $114,240 |
| 2021 | $3,054 | $134,240 | $20,000 | $114,240 |
| 2020 | $2,415 | $105,840 | $16,000 | $89,840 |
| 2019 | $3,462 | $105,840 | $16,000 | $89,840 |
| 2018 | $3,429 | $103,560 | $16,000 | $87,560 |
| 2017 | $3,131 | $93,752 | $16,000 | $77,752 |
| 2016 | $3,148 | $93,752 | $16,000 | $77,752 |
| 2015 | $2,944 | $87,752 | $10,000 | $77,752 |
| 2014 | $2,660 | $79,126 | $10,000 | $69,126 |
| 2013 | -- | $73,255 | $10,000 | $63,255 |
Source: Public Records
Map
Nearby Homes
- 319 Raven Ridge
- 357 Raven Ridge
- 295 Raven Ridge
- 342 Raven Ridge
- 356 Raven Ridge
- 320 Raven Ridge
- 296 Raven Ridge Unit 90
- 296 Raven Ridge
- 273 Raven Ridge
- 362 Raven Ridge
- 270 Raven Ridge
- 159 Robin Way
- 245 Raven Ridge
- 143 Robin Way
- 121 Robin Way
- 250 Raven Ridge
- 97 Robin Way
- 229 Raven Ridge
- 167 Robin Way
- 39 Ruby Robin Dr