
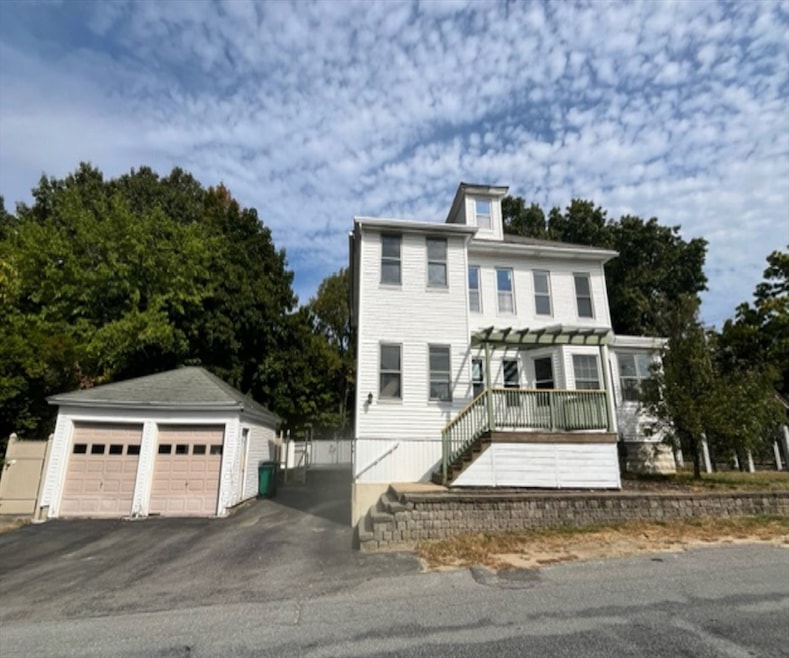
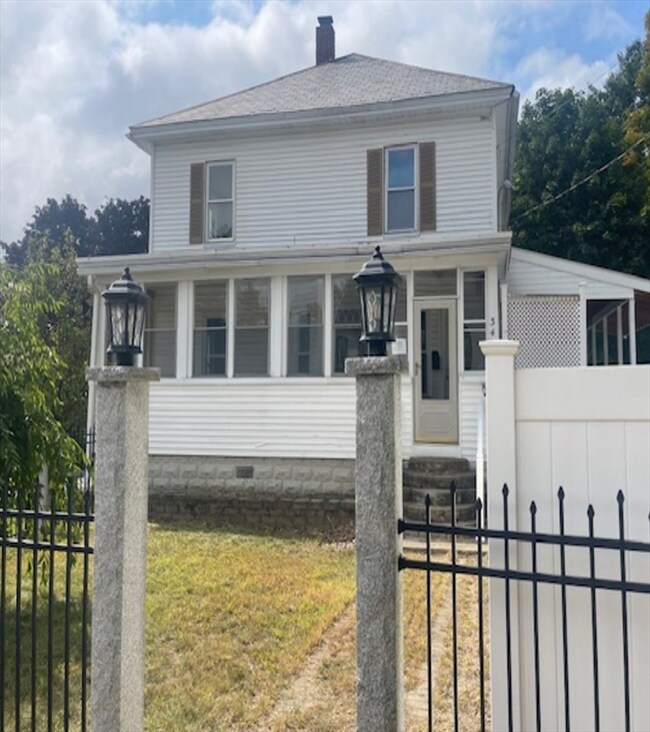
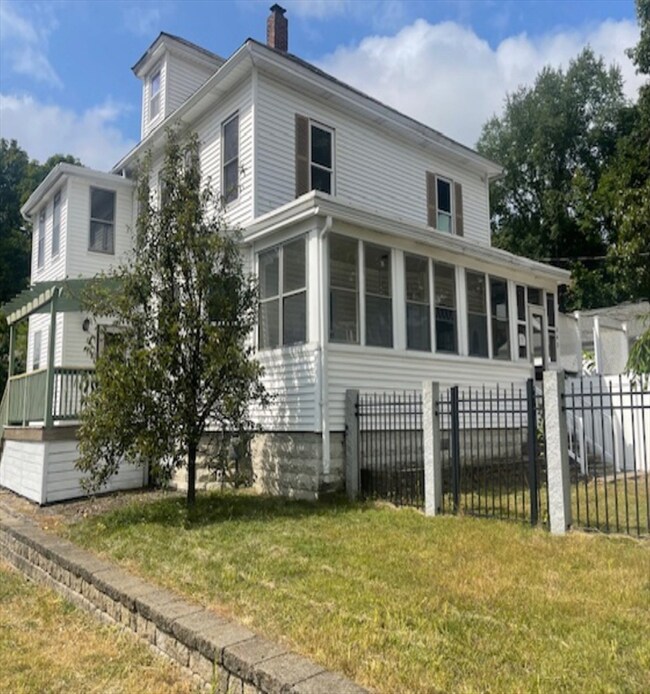
343 South St Fitchburg, MA 01420
Southside Neighborhood
4
Beds
2
Baths
1,934
Sq Ft
9,352
Sq Ft Lot
Highlights
- Medical Services
- Colonial Architecture
- Property is near public transit
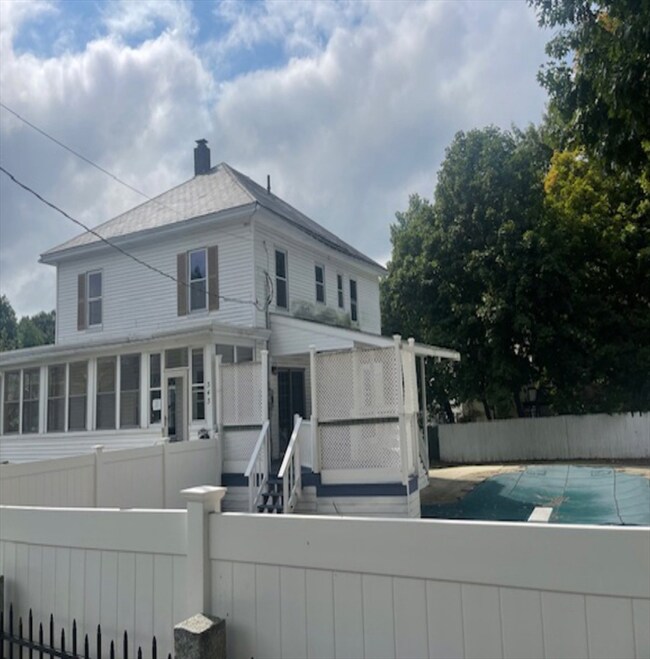
- In Ground Pool
- Deck
- Wood Flooring
About This Home
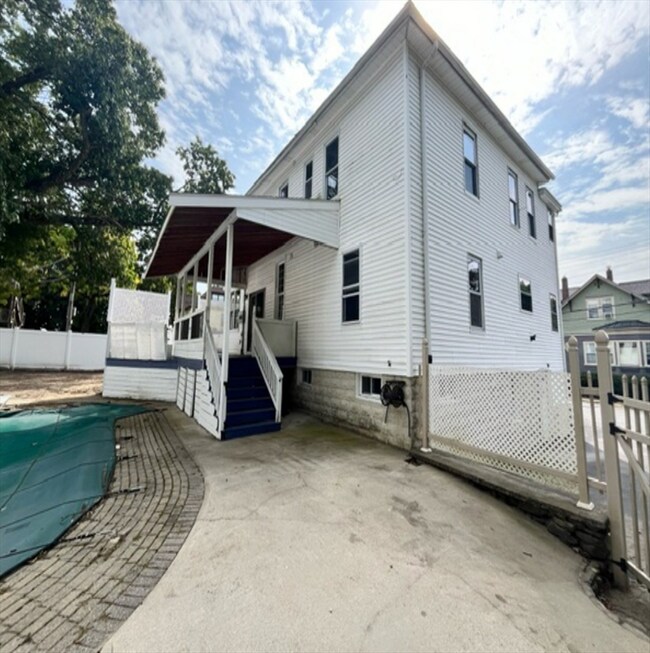
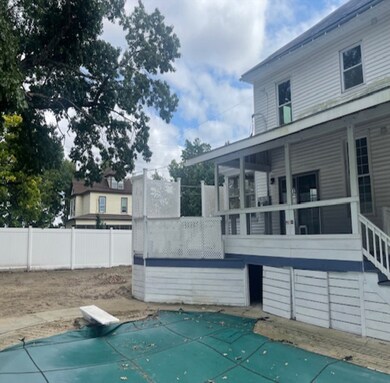
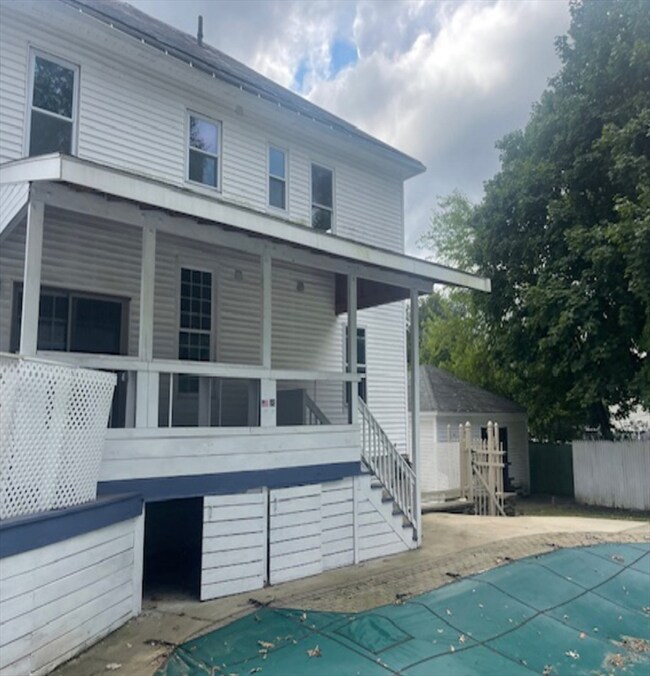
As of June 2025Stately 4-Bedroom colonial situated on a corner lot. Enjoy the deck and porch, along with an enclosed porch, fenced area with patio and inground pool. Detached garage and driveway parking. Attractive kitchen with white cabinets and granite counter island. 2-Bathrooms, one with a jetted tub. Wood floors in the main living areas and tile in the basement. Finished basement offers bonus living area and nice laundry room with a sink. Bring your vision of a renewed start for this lovely property. Excellent commuter location near Route 12 and Route 2, and Fitchburg T.
Home Details
Home Type
- Single Family
Est. Annual Taxes
- $5,537
Year Built
- Built in 1920
Lot Details
- 9,352 Sq Ft Lot
- Fenced Yard
- Fenced
- Corner Lot
- Level Lot
- Property is zoned RA
Parking
- 2 Car Detached Garage
- Open Parking
Home Design
- Colonial Architecture
- Block Foundation
- Frame Construction
- Slate Roof
- Concrete Perimeter Foundation
Interior Spaces
- 1,934 Sq Ft Home
- 1 Fireplace
- Home Office
- Bonus Room
Flooring
- Wood
- Tile
Bedrooms and Bathrooms
- 4 Bedrooms
- Primary bedroom located on second floor
- 2 Full Bathrooms
Partially Finished Basement
- Walk-Out Basement
- Basement Fills Entire Space Under The House
- Interior Basement Entry
- Laundry in Basement
Outdoor Features
- In Ground Pool
- Deck
- Enclosed patio or porch
Location
- Property is near public transit
- Property is near schools
Utilities
- No Cooling
- Heating System Uses Natural Gas
- Baseboard Heating
- Heating System Uses Steam
Listing and Financial Details
- Assessor Parcel Number M:0107 B:0018 L:0,1508163
Community Details
Overview
- No Home Owners Association
Amenities
- Medical Services
- Shops
Recreation
- Park
- Jogging Path
Ownership History
Date
Name
Owned For
Owner Type
Purchase Details
Listed on
May 6, 2025
Closed on
Jun 18, 2025
Sold by
J Martinez Invs Llc
Bought by
Dasilva Maria E and Almeida Werquely J
Seller's Agent
Raquel Martinez
Martinez Realty Group
Buyer's Agent
Marilene Araujo
United Brokers
List Price
$539,900
Sold Price
$555,000
Premium/Discount to List
$15,100
2.8%
Views
13
Home Financials for this Owner
Home Financials are based on the most recent Mortgage that was taken out on this home.
Avg. Annual Appreciation
-91.98%
Original Mortgage
$527,250
Outstanding Balance
$527,250
Interest Rate
6.76%
Mortgage Type
Purchase Money Mortgage
Estimated Equity
-$73,689
Purchase Details
Closed on
Aug 30, 2023
Sold by
Nationstar Mortgage Llc
Bought by
Amer Successors & Assign
Purchase Details
Closed on
Oct 24, 2003
Sold by
Mcneil George T and Mcneil Janet
Bought by
Cazard Sebastian
Home Financials for this Owner
Home Financials are based on the most recent Mortgage that was taken out on this home.
Original Mortgage
$191,000
Interest Rate
6.15%
Mortgage Type
Purchase Money Mortgage
Similar Homes in Fitchburg, MA
Create a Home Valuation Report for This Property
The Home Valuation Report is an in-depth analysis detailing your home's value as well as a comparison with similar homes in the area
Home Values in the Area
Average Home Value in this Area
Purchase History
| Date | Type | Sale Price | Title Company |
|---|---|---|---|
| Deed | $555,000 | None Available | |
| Warranty Deed | -- | None Available | |
| Warranty Deed | -- | None Available | |
| Warranty Deed | -- | None Available | |
| Deed | $202,500 | -- | |
| Deed | $202,500 | -- | |
| Deed | $202,500 | -- |
Source: Public Records
Mortgage History
| Date | Status | Loan Amount | Loan Type |
|---|---|---|---|
| Open | $527,250 | Purchase Money Mortgage | |
| Previous Owner | $288,000 | Purchase Money Mortgage | |
| Previous Owner | $254,353 | VA | |
| Previous Owner | $201,400 | Stand Alone Refi Refinance Of Original Loan | |
| Previous Owner | $50,000 | No Value Available | |
| Previous Owner | $251,010 | No Value Available | |
| Previous Owner | $224,100 | No Value Available | |
| Previous Owner | $224,100 | No Value Available | |
| Previous Owner | $191,000 | Purchase Money Mortgage |
Source: Public Records
Property History
| Date | Event | Price | Change | Sq Ft Price |
|---|---|---|---|---|
| 06/18/2025 06/18/25 | Sold | $555,000 | +2.8% | $190 / Sq Ft |
| 05/12/2025 05/12/25 | Pending | -- | -- | -- |
| 05/06/2025 05/06/25 | For Sale | $539,900 | +50.0% | $185 / Sq Ft |
| 01/13/2025 01/13/25 | Sold | $360,000 | -7.7% | $186 / Sq Ft |
| 12/11/2024 12/11/24 | Pending | -- | -- | -- |
| 11/13/2024 11/13/24 | Price Changed | $390,000 | -4.9% | $202 / Sq Ft |
| 10/01/2024 10/01/24 | For Sale | $410,000 | +64.7% | $212 / Sq Ft |
| 10/27/2016 10/27/16 | Sold | $249,000 | -0.4% | $129 / Sq Ft |
| 09/23/2016 09/23/16 | Pending | -- | -- | -- |
| 09/09/2016 09/09/16 | Price Changed | $249,900 | 0.0% | $129 / Sq Ft |
| 09/09/2016 09/09/16 | For Sale | $249,900 | +2.0% | $129 / Sq Ft |
| 08/23/2016 08/23/16 | Pending | -- | -- | -- |
| 08/18/2016 08/18/16 | For Sale | $244,900 | -- | $127 / Sq Ft |
Source: MLS Property Information Network (MLS PIN)
Tax History Compared to Growth
Tax History
| Year | Tax Paid | Tax Assessment Tax Assessment Total Assessment is a certain percentage of the fair market value that is determined by local assessors to be the total taxable value of land and additions on the property. | Land | Improvement |
|---|---|---|---|---|
| 2025 | $56 | $410,900 | $104,100 | $306,800 |
| 2024 | $5,537 | $373,900 | $69,500 | $304,400 |
| 2023 | $5,472 | $341,600 | $60,900 | $280,700 |
| 2022 | $5,170 | $293,600 | $52,200 | $241,400 |
| 2021 | $1,648 | $270,800 | $42,200 | $228,600 |
| 2020 | $5,022 | $254,800 | $39,700 | $215,100 |
| 2019 | $4,952 | $240,900 | $52,200 | $188,700 |
| 2018 | $1,450 | $226,800 | $48,400 | $178,400 |
| 2017 | $4,676 | $217,600 | $48,400 | $169,200 |
| 2016 | $3,503 | $165,000 | $45,900 | $119,100 |
| 2015 | $3,338 | $161,400 | $44,700 | $116,700 |
| 2014 | $3,187 | $160,700 | $44,700 | $116,000 |
Source: Public Records
Agents Affiliated with this Home
-
Raquel Martinez
R
Seller's Agent in 2025
Raquel Martinez
Martinez Realty Group
(617) 561-1009
9 in this area
56 Total Sales
-
Michael Madulka
Seller's Agent in 2025
Michael Madulka
Quinsigamond Realty
(508) 579-7777
1 in this area
77 Total Sales
-
Jose Martinez
J
Seller Co-Listing Agent in 2025
Jose Martinez
Martinez Realty Group
(617) 759-4321
2 in this area
16 Total Sales
-
Marilene Araujo
Buyer's Agent in 2025
Marilene Araujo
United Brokers
(781) 424-7935
1 in this area
56 Total Sales
-
Maria Tolman
Seller's Agent in 2016
Maria Tolman
Venture
(978) 790-0910
49 Total Sales
-
Lila Boates
Buyer's Agent in 2016
Lila Boates
Ellis Residential Group
(978) 404-9790
32 Total Sales
Map
Source: MLS Property Information Network (MLS PIN)
MLS Number: 73296770
APN: FITC-000107-000018
Disclaimer: Certain information contained herein is derived from information provided by parties other than Homes.com. All information provided is deemed reliable, but is not guaranteed to be accurate and should be independently verified.
![]() The property listing data and information, or the Images, set forth herein were provided to MLS Property Information Network, Inc. from third party sources, including sellers, lessors and public records, and were compiled by MLS Property Information Network, Inc. The property listing data and information, and the Images, are for the personal, non-commercial use of consumers having a good faith interest in purchasing or leasing listed properties of the type displayed to them and may not be used for any purpose other than to identify prospective properties which such consumers may have a good faith interest in purchasing or leasing. MLS Property Information Network, Inc. and its subscribers disclaim any and all representations and warranties as to the accuracy of the property listing data and information, or as to the accuracy of any of the Images, set forth herein.
The property listing data and information, or the Images, set forth herein were provided to MLS Property Information Network, Inc. from third party sources, including sellers, lessors and public records, and were compiled by MLS Property Information Network, Inc. The property listing data and information, and the Images, are for the personal, non-commercial use of consumers having a good faith interest in purchasing or leasing listed properties of the type displayed to them and may not be used for any purpose other than to identify prospective properties which such consumers may have a good faith interest in purchasing or leasing. MLS Property Information Network, Inc. and its subscribers disclaim any and all representations and warranties as to the accuracy of the property listing data and information, or as to the accuracy of any of the Images, set forth herein.
Nearby Homes