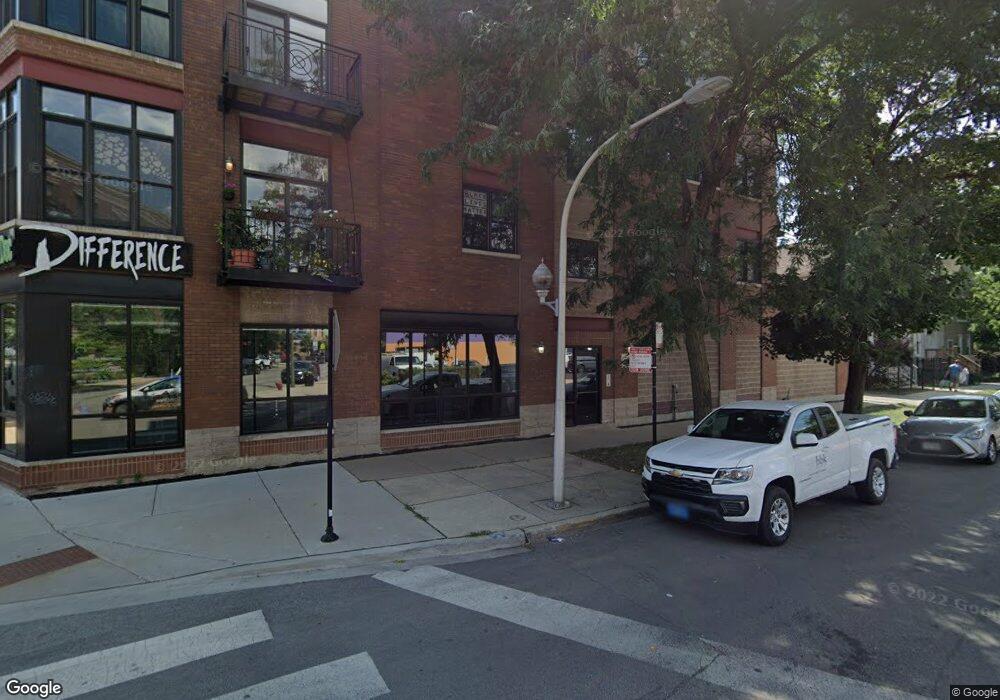
3430 N Lincoln Ave Unit 1 Chicago, IL 60657
Southport Corridor NeighborhoodEstimated Value: $321,626
--
Bed
--
Bath
9,999
Sq Ft
$32/Sq Ft
Est. Value
About This Home
This home is located at 3430 N Lincoln Ave Unit 1, Chicago, IL 60657 and is currently estimated at $321,626, approximately $32 per square foot. 3430 N Lincoln Ave Unit 1 is a home located in Cook County with nearby schools including Hamilton Elementary School, Lake View High School, and Saint Andrew School.
Ownership History
Date
Name
Owned For
Owner Type
Purchase Details
Closed on
Nov 22, 2023
Sold by
Mcnamara Builders Inc
Bought by
Gathering Loft Events Llc
Current Estimated Value
Purchase Details
Closed on
Feb 12, 2021
Sold by
Thomas Newport Llc
Bought by
Mcnamara Builders Inc
Purchase Details
Closed on
Aug 26, 2004
Sold by
Thomas Newport Llc
Bought by
Knoppers Jessica R
Home Financials for this Owner
Home Financials are based on the most recent Mortgage that was taken out on this home.
Original Mortgage
$330,000
Interest Rate
5.25%
Mortgage Type
Purchase Money Mortgage
Purchase Details
Closed on
Nov 13, 2002
Sold by
North Star Trust Co
Bought by
Thomas Newport Llc
Home Financials for this Owner
Home Financials are based on the most recent Mortgage that was taken out on this home.
Original Mortgage
$610,000
Interest Rate
4.25%
Mortgage Type
Commercial
Create a Home Valuation Report for This Property
The Home Valuation Report is an in-depth analysis detailing your home's value as well as a comparison with similar homes in the area
Home Values in the Area
Average Home Value in this Area
Purchase History
| Date | Buyer | Sale Price | Title Company |
|---|---|---|---|
| Gathering Loft Events Llc | $285,000 | Old Republic Title | |
| Mcnamara Builders Inc | -- | Old Republic Title | |
| Knoppers Jessica R | $425,000 | 1St American Title | |
| Thomas Newport Llc | $610,000 | Mtc |
Source: Public Records
Mortgage History
| Date | Status | Borrower | Loan Amount |
|---|---|---|---|
| Previous Owner | Knoppers Jessica R | $330,000 | |
| Previous Owner | Thomas Newport Llc | $610,000 |
Source: Public Records
Tax History Compared to Growth
Tax History
| Year | Tax Paid | Tax Assessment Tax Assessment Total Assessment is a certain percentage of the fair market value that is determined by local assessors to be the total taxable value of land and additions on the property. | Land | Improvement |
|---|---|---|---|---|
| 2024 | $17,950 | $59,000 | $18,191 | $40,809 |
| 2023 | $17,489 | $82,712 | $1,589 | $81,123 |
| 2022 | $17,489 | $82,712 | $1,589 | $81,123 |
| 2021 | $17,087 | $82,711 | $1,588 | $81,123 |
| 2020 | $18,993 | $83,011 | $1,588 | $81,423 |
| 2019 | $17,155 | $83,011 | $1,588 | $81,423 |
| 2018 | $16,866 | $83,011 | $1,588 | $81,423 |
| 2017 | $15,619 | $70,480 | $1,588 | $68,892 |
| 2016 | $14,555 | $70,480 | $1,588 | $68,892 |
| 2015 | $13,344 | $70,480 | $1,588 | $68,892 |
| 2014 | $11,632 | $60,523 | $1,588 | $58,935 |
| 2013 | $11,410 | $60,523 | $1,588 | $58,935 |
Source: Public Records
Map
Nearby Homes
- 1743 W Newport Ave
- 1753 W Cornelia Ave
- 1753 W Henderson St
- 3438 N Ashland Ave Unit 2N
- 3342 N Ravenswood Ave
- 3448 N Ashland Ave Unit 2S
- 3255 N Paulina St Unit 2B
- 1645 W School St Unit 418
- 3422 N Bosworth Ave Unit 1
- 3418 N Wolcott Ave Unit 1
- 1807 W Addison St Unit 2W
- 1541 W Henderson St Unit D
- 3507 N Bosworth Ave
- 1833 W Addison St Unit 2
- 1623 W Melrose St Unit 501
- 3621 N Ravenswood Ave
- 1738 W Belmont Ave Unit 1R
- 3201 N Ravenswood Ave Unit 301
- 1931 W Cornelia Ave
- 1447 W Roscoe St Unit PH
- 3422 N Lincoln Ave
- 3422 N Lincoln Ave Unit STORE
- 3422 N Lincoln Ave Unit 3
- 3422 N Lincoln Ave Unit 4
- 3422 N Lincoln Ave Unit 2
- 1717 W Newport Ave Unit 3
- 1717 W Newport Ave Unit 4
- 1717 W Newport Ave Unit 2
- 1717 W Newport Ave Unit 1
- 3420 N Lincoln Ave Unit 303
- 3420 N Lincoln Ave Unit 204
- 3420 N Lincoln Ave Unit 205
- 3420 N Lincoln Ave Unit 203
- 3420 N Lincoln Ave Unit 301
- 3420 N Lincoln Ave Unit 201
- 3426 N Lincoln Ave
- 3426 N Lincoln Ave Unit A08C
- 3426 N Lincoln Ave Unit 3
- 3426 N Lincoln Ave Unit 4
- 3426 N Lincoln Ave Unit 2