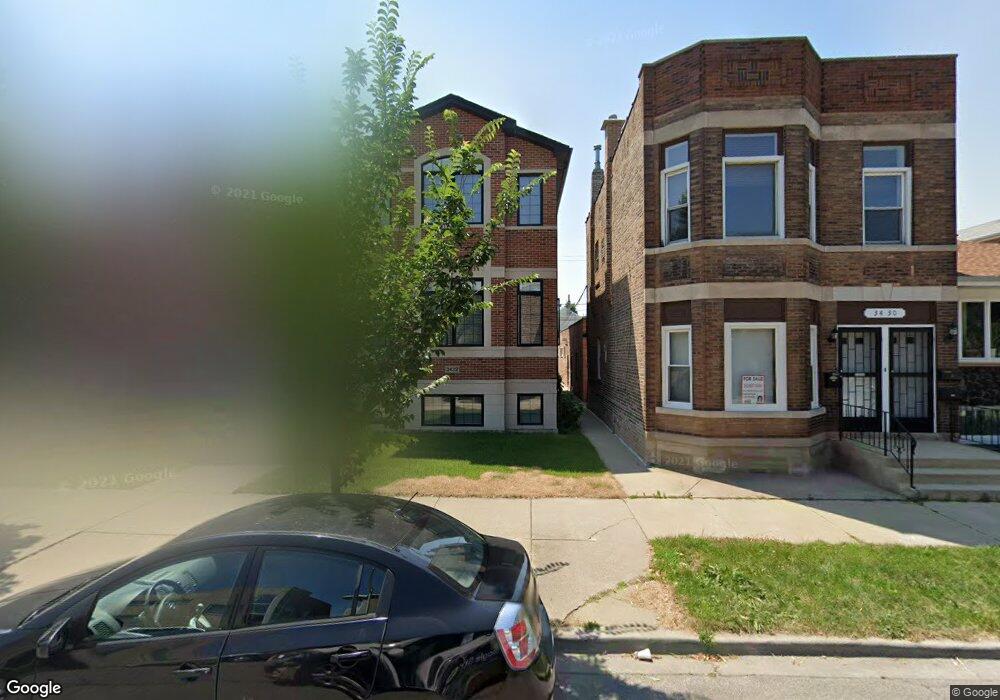
3432 S Parnell Ave Chicago, IL 60616
Bridgeport NeighborhoodEstimated Value: $751,846 - $1,123,000
4
Beds
4
Baths
3,600
Sq Ft
$251/Sq Ft
Est. Value
About This Home
This home is located at 3432 S Parnell Ave, Chicago, IL 60616 and is currently estimated at $904,212, approximately $251 per square foot. 3432 S Parnell Ave is a home located in Cook County with nearby schools including McClellan Elementary School and Bridgeport Catholic Academy - South Campus.
Ownership History
Date
Name
Owned For
Owner Type
Purchase Details
Closed on
Dec 12, 2024
Sold by
Ma Kwan Wing and Lai Ling
Bought by
Kwan Wing Ma Revocable Trust and Lai Ling Ma Revocable Trust
Current Estimated Value
Purchase Details
Closed on
May 7, 2008
Sold by
Lacoco Michael A and Lacoco Debra
Bought by
Ma Kwan Wing and Ma Lai Ling
Home Financials for this Owner
Home Financials are based on the most recent Mortgage that was taken out on this home.
Original Mortgage
$320,000
Interest Rate
6.15%
Mortgage Type
Unknown
Purchase Details
Closed on
Nov 17, 2005
Sold by
Gleason Mary
Bought by
Lacoco Michael
Purchase Details
Closed on
Dec 17, 1994
Sold by
Vaccaro Joseph R and Vaccaro Ruth Mary
Bought by
Vaccaro Joseph R and Gleason Mary
Create a Home Valuation Report for This Property
The Home Valuation Report is an in-depth analysis detailing your home's value as well as a comparison with similar homes in the area
Home Values in the Area
Average Home Value in this Area
Purchase History
| Date | Buyer | Sale Price | Title Company |
|---|---|---|---|
| Kwan Wing Ma Revocable Trust | -- | None Listed On Document | |
| Kwan Wing Ma Revocable Trust | -- | None Listed On Document | |
| Ma Kwan Wing | $640,000 | Multiple | |
| Lacoco Michael | $900,000 | Republic Title Co | |
| Vaccaro Joseph R | -- | -- |
Source: Public Records
Mortgage History
| Date | Status | Borrower | Loan Amount |
|---|---|---|---|
| Previous Owner | Ma Kwan Wing | $320,000 |
Source: Public Records
Tax History Compared to Growth
Tax History
| Year | Tax Paid | Tax Assessment Tax Assessment Total Assessment is a certain percentage of the fair market value that is determined by local assessors to be the total taxable value of land and additions on the property. | Land | Improvement |
|---|---|---|---|---|
| 2024 | $6,218 | $66,000 | $17,233 | $48,767 |
| 2023 | $6,254 | $47,600 | $13,913 | $33,687 |
| 2022 | $6,254 | $51,000 | $13,913 | $37,087 |
| 2021 | $5,953 | $50,999 | $13,912 | $37,087 |
| 2020 | $6,144 | $42,362 | $13,912 | $28,450 |
| 2019 | $6,125 | $47,598 | $13,912 | $33,686 |
| 2018 | $6,033 | $52,581 | $13,912 | $38,669 |
| 2017 | $6,459 | $40,059 | $11,067 | $28,992 |
| 2016 | $6,780 | $40,059 | $11,067 | $28,992 |
| 2015 | $6,517 | $40,059 | $11,067 | $28,992 |
| 2014 | $6,520 | $39,542 | $9,486 | $30,056 |
| 2013 | $6,713 | $39,542 | $9,486 | $30,056 |
Source: Public Records
Map
Nearby Homes
- 3505 S Parnell Ave Unit D
- 3322 S Parnell Ave
- 3405 S Union Ave
- 3315 S Lowe Ave
- 3549 S Lowe Ave
- 3416 S Union Ave
- 3357 S Emerald Ave
- 3246 S Normal Ave
- 3600 S Union Ave
- 3640 S Lowe Ave
- 3247 S Emerald Ave
- 3214 S Canal St
- 3450 S Halsted St Unit 406
- 3212 S Union Ave
- 835 W 35th St
- 3600 S Halsted St
- 3727 S Lowe Ave
- 3148 S Union Ave
- 3234 S Princeton Ave
- 3120 S Normal Ave
- 3428 S Parnell Ave
- 3438 S Parnell Ave
- 3436 S Parnell Ave
- 3440 S Parnell Ave
- 3426 S Parnell Ave
- 3422 S Parnell Ave
- 3420 S Parnell Ave
- 3433 S Wallace St
- 3435 S Wallace St
- 3427 S Wallace St
- 3418 S Parnell Ave
- 3439 S Wallace St
- 3429 S Wallace St
- 3429 S Wallace St
- 3443 S Wallace St
- 3414 S Parnell Ave
- 3458 S Parnell Ave
- 3421 S Wallace St
- 3421 S Wallace St Unit 1
- 3421 S Wallace St Unit 2