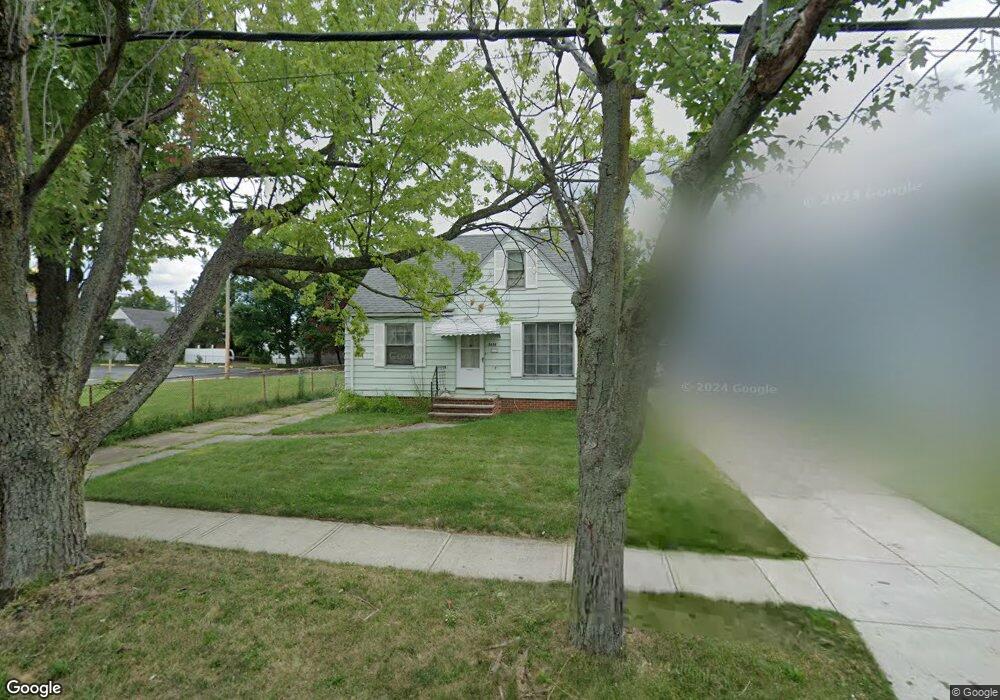
3434 Liggett Dr Cleveland, OH 44134
Estimated Value: $156,000 - $173,000
3
Beds
1
Bath
1,092
Sq Ft
$149/Sq Ft
Est. Value
About This Home
This home is located at 3434 Liggett Dr, Cleveland, OH 44134 and is currently estimated at $162,628, approximately $148 per square foot. 3434 Liggett Dr is a home located in Cuyahoga County with nearby schools including John Muir Elementary School, Shiloh Middle School, and Parma High School.
Ownership History
Date
Name
Owned For
Owner Type
Purchase Details
Closed on
Jan 14, 2001
Sold by
Stefanyk Mary
Bought by
Stefanyk Mary and Dobriansky Lesia
Current Estimated Value
Purchase Details
Closed on
May 7, 1999
Sold by
Stefanyk Mary
Bought by
Stefanyk Mary and Dobriansky Lesia Rozallia
Purchase Details
Closed on
Dec 2, 1998
Sold by
Dobriansky Lesia
Bought by
Stefanyk Mary
Purchase Details
Closed on
Oct 25, 1998
Sold by
Stefanyk Mary
Bought by
Dobriansky Lesia
Purchase Details
Closed on
Jul 27, 1990
Sold by
Shijo Ronald and Shijo Susan
Bought by
Lilly Harry R
Purchase Details
Closed on
Nov 6, 1986
Sold by
Huang David T
Bought by
Shijo Ronald and Shijo Susan
Purchase Details
Closed on
Mar 7, 1980
Sold by
Heilman Wesley A
Bought by
Huang David T
Purchase Details
Closed on
Dec 22, 1977
Sold by
Basak Pattie M
Bought by
Heilman Wesley A
Purchase Details
Closed on
Jan 1, 1975
Bought by
Basak Pattie M
Create a Home Valuation Report for This Property
The Home Valuation Report is an in-depth analysis detailing your home's value as well as a comparison with similar homes in the area
Home Values in the Area
Average Home Value in this Area
Purchase History
| Date | Buyer | Sale Price | Title Company |
|---|---|---|---|
| Stefanyk Mary | -- | -- | |
| Stefanyk Mary | -- | -- | |
| Stefanyk Mary | -- | -- | |
| Dobriansky Lesia | -- | -- | |
| Lilly Harry R | $56,000 | -- | |
| Shijo Ronald | $40,000 | -- | |
| Huang David T | $49,000 | -- | |
| Heilman Wesley A | $42,000 | -- | |
| Basak Pattie M | -- | -- |
Source: Public Records
Tax History Compared to Growth
Tax History
| Year | Tax Paid | Tax Assessment Tax Assessment Total Assessment is a certain percentage of the fair market value that is determined by local assessors to be the total taxable value of land and additions on the property. | Land | Improvement |
|---|---|---|---|---|
| 2024 | $2,776 | $44,345 | $9,940 | $34,405 |
| 2023 | $2,717 | $37,730 | $8,190 | $29,540 |
| 2022 | $2,691 | $37,730 | $8,190 | $29,540 |
| 2021 | $2,766 | $37,730 | $8,190 | $29,540 |
| 2020 | $2,426 | $29,020 | $6,300 | $22,720 |
| 2019 | $2,318 | $82,900 | $18,000 | $64,900 |
| 2018 | $2,332 | $29,020 | $6,300 | $22,720 |
| 2017 | $2,205 | $25,520 | $4,690 | $20,830 |
| 2016 | $2,191 | $25,520 | $4,690 | $20,830 |
| 2015 | $2,078 | $25,520 | $4,690 | $20,830 |
| 2014 | $2,078 | $26,050 | $4,800 | $21,250 |
Source: Public Records
Map
Nearby Homes
- 3104 Liggett Dr
- 2907 Liggett Dr
- 3910 Wood Ave
- 4005 Pershing Ave
- 3436 Heresford Dr
- 4000 Pershing Ave
- 3019 Torrington Ave
- 4424 Forestwood Dr
- 5850 S Park Blvd
- 4002 Maplecrest Ave
- 2923 Brookdale Ave
- 2821 Parklane Dr
- 4420 Torrington Ave
- 4409 Milford Ave
- 2829 Maplecrest Ave
- 5432 State Rd
- 2503 Brookdale Ave
- 2809 Wales Ave
- 4710 Maplecrest Ave
- 3714 Russell Ave
- 3430 Liggett Dr
- 3424 Liggett Dr
- 3420 Liggett Dr
- 3433 Lucerne Ave
- 3437 Lucerne Ave
- 3429 Lucerne Ave
- 3425 Lucerne Ave
- 3414 Liggett Dr
- 3421 Lucerne Ave
- 5735 State Rd
- 3417 Lucerne Ave
- 3410 Liggett Dr
- 3421 Liggett Dr
- 3413 Lucerne Ave
- 3415 Liggett Dr
- 3409 Lucerne Ave
- 3411 Liggett Dr
- 3404 Liggett Dr
- 3405 Lucerne Ave
- 3420 Snow Rd