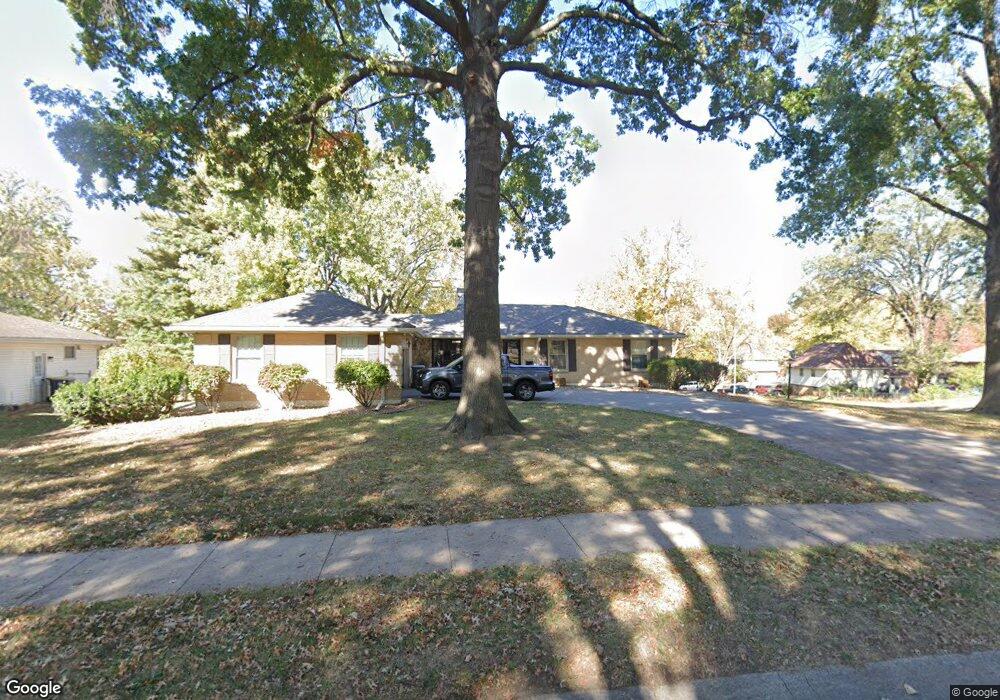
3434 N Chippewa Dr Kansas City, MO 64116
River Forest NeighborhoodEstimated Value: $329,000 - $374,000
3
Beds
4
Baths
2,950
Sq Ft
$120/Sq Ft
Est. Value
About This Home
This home is located at 3434 N Chippewa Dr, Kansas City, MO 64116 and is currently estimated at $353,978, approximately $119 per square foot. 3434 N Chippewa Dr is a home located in Clay County with nearby schools including Crestview Elementary School, Northgate Middle School, and North Kansas City High School.
Ownership History
Date
Name
Owned For
Owner Type
Purchase Details
Closed on
Nov 20, 2008
Sold by
Kramer Jeremiah J and Kramer Nicole M
Bought by
Kramer Nicole M and Kramer Jeremiah J
Current Estimated Value
Purchase Details
Closed on
Sep 10, 2003
Sold by
Castillo Antonio V and Castillo Sheryl L
Bought by
Castillo Christopher H and Stuteville Regina D
Purchase Details
Closed on
Jun 4, 2003
Sold by
Gilkey Alice M
Bought by
Castillo Antonio and Castillo Sheryl L
Home Financials for this Owner
Home Financials are based on the most recent Mortgage that was taken out on this home.
Original Mortgage
$126,400
Outstanding Balance
$55,209
Interest Rate
5.74%
Mortgage Type
Purchase Money Mortgage
Estimated Equity
$298,769
Purchase Details
Closed on
May 7, 1998
Sold by
Halstead Bernice L
Bought by
Gilkey Alice M
Home Financials for this Owner
Home Financials are based on the most recent Mortgage that was taken out on this home.
Original Mortgage
$94,000
Interest Rate
7.09%
Create a Home Valuation Report for This Property
The Home Valuation Report is an in-depth analysis detailing your home's value as well as a comparison with similar homes in the area
Home Values in the Area
Average Home Value in this Area
Purchase History
| Date | Buyer | Sale Price | Title Company |
|---|---|---|---|
| Kramer Nicole M | -- | None Available | |
| Castillo Christopher H | -- | -- | |
| Castillo Antonio | -- | Stewart Title | |
| Gilkey Alice M | $117,500 | -- |
Source: Public Records
Mortgage History
| Date | Status | Borrower | Loan Amount |
|---|---|---|---|
| Open | Castillo Antonio | $126,400 | |
| Previous Owner | Gilkey Alice M | $94,000 |
Source: Public Records
Tax History Compared to Growth
Tax History
| Year | Tax Paid | Tax Assessment Tax Assessment Total Assessment is a certain percentage of the fair market value that is determined by local assessors to be the total taxable value of land and additions on the property. | Land | Improvement |
|---|---|---|---|---|
| 2025 | $4,141 | $58,330 | -- | -- |
| 2024 | $4,141 | $51,400 | -- | -- |
| 2023 | $4,104 | $51,400 | $0 | $0 |
| 2022 | $3,653 | $43,720 | $0 | $0 |
| 2021 | $3,657 | $43,719 | $3,800 | $39,919 |
| 2020 | $3,366 | $37,220 | $0 | $0 |
| 2019 | $3,303 | $37,221 | $3,420 | $33,801 |
| 2018 | $2,980 | $32,090 | $0 | $0 |
| 2017 | $2,926 | $32,090 | $3,800 | $28,290 |
| 2016 | $2,926 | $32,090 | $3,800 | $28,290 |
| 2015 | $2,925 | $32,090 | $3,800 | $28,290 |
| 2014 | $2,969 | $32,090 | $3,800 | $28,290 |
Source: Public Records
Map
Nearby Homes
- 3409 N Mohawk Ln
- 3320 Mohawk Ln
- 3300 N Chippewa Dr
- 3628 N Flora Ave
- 3641 N Prather Rd
- 3625 N Park Ave
- 3711 N Wayne Ave
- 3638 N Woodland Ave
- 1437 E 25th Ave
- 2425 NE 38th St
- 1440 E 24th Ave
- 1409 NE Russell Rd
- 2204 NE 39th St
- 2505 NE 38th St
- 2436 NE 38th St
- 1232 E 24th Ave
- 3834 NE Antioch Rd
- 1234 E 22nd Ave
- 3801 NE Antioch Rd
- 3135 NE Winn Rd
- 3434 N Chippewa Dr
- 3424 N Chippewa Dr
- 1913 NE 34th Place
- 1907 NE 34th Place
- 3425 N Chippewa Dr
- 3412 N Chippewa Dr
- 1919 NE 34th Place
- 1901 NE 34th Place
- 3439 N Chippewa Dr
- 3415 N Chippewa Dr
- 3439 NE Chippewa Dr
- 3444 N Chippewa Dr
- 2001 NE 34th Place
- 3445 N Chippewa Dr
- 3406 N Chippewa Dr
- 3400 Mohawk Ln
- 3409 N Chippewa Dr
- 1906 NE 34th Place
- 1912 NE 34th Place
- 1900 NE 34th Place