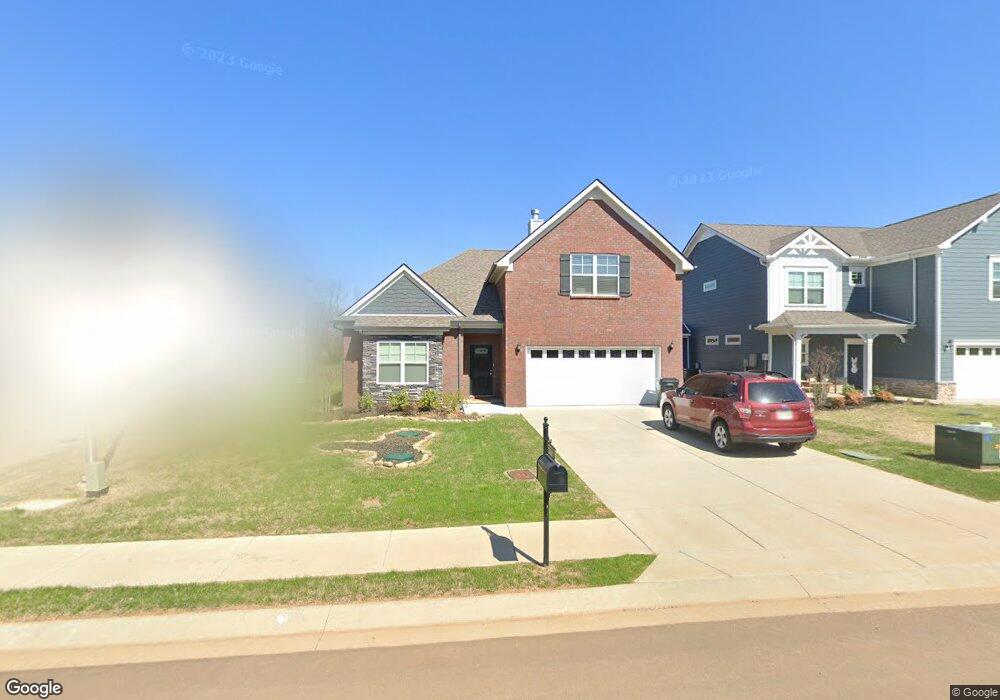
3434 Pear Blossom Way Murfreesboro, TN 37127
Estimated Value: $454,000 - $495,000
3
Beds
3
Baths
2,136
Sq Ft
$221/Sq Ft
Est. Value
About This Home
This home is located at 3434 Pear Blossom Way, Murfreesboro, TN 37127 and is currently estimated at $472,044, approximately $220 per square foot. 3434 Pear Blossom Way is a home located in Rutherford County with nearby schools including Black Fox Elementary School, Buchanan Elementary School, and Whitworth-Buchanan Middle School.
Ownership History
Date
Name
Owned For
Owner Type
Purchase Details
Closed on
Nov 25, 2019
Sold by
Ole South Properties Inc
Bought by
Pragel Courtney
Current Estimated Value
Home Financials for this Owner
Home Financials are based on the most recent Mortgage that was taken out on this home.
Original Mortgage
$267,990
Outstanding Balance
$236,962
Interest Rate
3.75%
Mortgage Type
New Conventional
Estimated Equity
$235,082
Purchase Details
Closed on
Nov 5, 2019
Sold by
Ole South Holdings Inc
Bought by
Ole South Properties Inc
Home Financials for this Owner
Home Financials are based on the most recent Mortgage that was taken out on this home.
Original Mortgage
$267,990
Outstanding Balance
$236,962
Interest Rate
3.75%
Mortgage Type
New Conventional
Estimated Equity
$235,082
Purchase Details
Closed on
Jan 28, 2019
Sold by
Mankin Pointe Llc
Bought by
Ole South Holdings Inc
Home Financials for this Owner
Home Financials are based on the most recent Mortgage that was taken out on this home.
Original Mortgage
$225,992
Interest Rate
4.6%
Mortgage Type
Construction
Create a Home Valuation Report for This Property
The Home Valuation Report is an in-depth analysis detailing your home's value as well as a comparison with similar homes in the area
Home Values in the Area
Average Home Value in this Area
Purchase History
| Date | Buyer | Sale Price | Title Company |
|---|---|---|---|
| Pragel Courtney | $297,990 | None Available | |
| Ole South Properties Inc | -- | Tri State Title & Escrow Llc | |
| Ole South Holdings Inc | -- | Tri Star Title & Escrow Llc |
Source: Public Records
Mortgage History
| Date | Status | Borrower | Loan Amount |
|---|---|---|---|
| Open | Pragel Courtney | $267,990 | |
| Previous Owner | Ole South Holdings Inc | $225,992 |
Source: Public Records
Tax History Compared to Growth
Tax History
| Year | Tax Paid | Tax Assessment Tax Assessment Total Assessment is a certain percentage of the fair market value that is determined by local assessors to be the total taxable value of land and additions on the property. | Land | Improvement |
|---|---|---|---|---|
| 2025 | $2,788 | $98,550 | $15,000 | $83,550 |
| 2024 | $2,788 | $98,550 | $15,000 | $83,550 |
| 2023 | $1,849 | $98,550 | $15,000 | $83,550 |
| 2022 | $1,593 | $98,550 | $15,000 | $83,550 |
| 2021 | $1,650 | $74,325 | $15,000 | $59,325 |
| 2020 | $1,650 | $74,325 | $15,000 | $59,325 |
| 2019 | $952 | $15,000 | $15,000 | $0 |
Source: Public Records
Map
Nearby Homes
- 2264 Alydar Run
- 2410 Lightbend Dr
- 2727 Brittany Trace
- 2303 Alydar Run
- 4218 Golden Sun Ct
- 1324 Sunray Dr
- 2021 Keenland Dr
- 4203 Sarazen Ln
- 1845 Streamsong Dr
- 1843 Streamsong Dr
- 1847 Streamsong Dr
- 4262 Golden Sun Ct
- 1840 Streamsong Dr
- 2747 Candlewick Ct
- 4316 Doral Dr
- 1926 Irby Ln
- 4325 Calusa Dr
- 4327 Calusa Dr
- 4329 Calusa Dr
- 2725 Apple Cross Ct
- 3434 Pear Blossom Way
- 3430 Pear Blossom Way
- 3438 Pear Blossom Way
- 3426 Pear Blossom Way
- 3426 Pear Blossom Way Unit 34
- 3504 Pear Blossom Way
- 3504 Pear Blossom Way
- 3435 Pear Blossom Way
- 3435 Pear Blossom Way
- 3439 Pear Blossom Way
- 3508 Pear Blossom Way
- 3414 Pear Blossom Way
- 3422 Pear Blossom Way
- 3431 Pear Blossom Way
- 3505 Pear Blossom Way Lot 4
- 3427 Pear Blossom Way
- 3418 Pear Blossom Way
- 3512 Pear Blossom Way
- 3481 Manchester Pike Unit 37330408
- 3481 Manchester Pike Unit 37330406