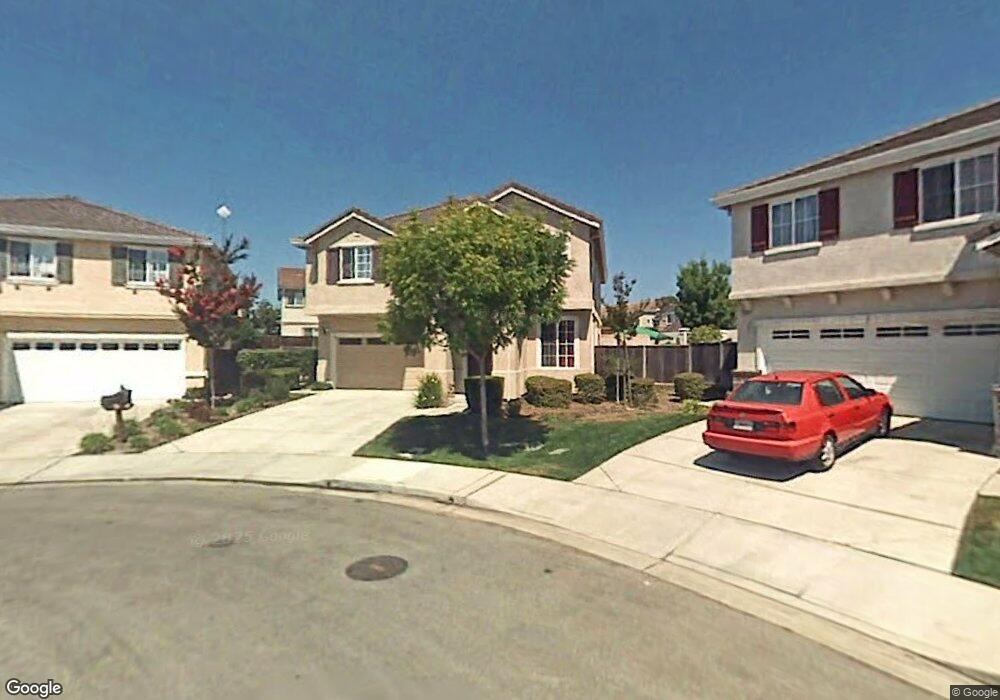
34345 Torrey Pine Ln Union City, CA 94587
Downtown Union City NeighborhoodEstimated Value: $1,739,000 - $1,959,000
5
Beds
4
Baths
2,671
Sq Ft
$683/Sq Ft
Est. Value
About This Home
This home is located at 34345 Torrey Pine Ln, Union City, CA 94587 and is currently estimated at $1,823,271, approximately $682 per square foot. 34345 Torrey Pine Ln is a home located in Alameda County with nearby schools including Guy Jr. Emanuele Elementary School, Cesar Chavez Middle School, and James Logan High School.
Ownership History
Date
Name
Owned For
Owner Type
Purchase Details
Closed on
Aug 21, 2006
Sold by
Ly Phung K and Ly Nguyet T
Bought by
Ly Phung K and Ly Nguyet T
Current Estimated Value
Home Financials for this Owner
Home Financials are based on the most recent Mortgage that was taken out on this home.
Original Mortgage
$625,000
Outstanding Balance
$375,036
Interest Rate
6.75%
Mortgage Type
Purchase Money Mortgage
Estimated Equity
$1,448,235
Purchase Details
Closed on
Jun 30, 2003
Sold by
Ly Phung K and Ly Tal Ngan
Bought by
Ly Phung K and Ly Eric Pulliam
Home Financials for this Owner
Home Financials are based on the most recent Mortgage that was taken out on this home.
Original Mortgage
$500,000
Interest Rate
4.12%
Mortgage Type
Purchase Money Mortgage
Purchase Details
Closed on
Nov 8, 2000
Sold by
Greystone Homes Inc
Bought by
Ly Phung K
Home Financials for this Owner
Home Financials are based on the most recent Mortgage that was taken out on this home.
Original Mortgage
$431,850
Interest Rate
7.87%
Create a Home Valuation Report for This Property
The Home Valuation Report is an in-depth analysis detailing your home's value as well as a comparison with similar homes in the area
Home Values in the Area
Average Home Value in this Area
Purchase History
| Date | Buyer | Sale Price | Title Company |
|---|---|---|---|
| Ly Phung K | $208,500 | Fidelity National Title Co | |
| Ly Nguyet T | -- | Fidelity National Title Co | |
| Ly Phung K | $250,000 | Alliance Title Company | |
| Ly Phung K | $584,000 | Chicago Title Co |
Source: Public Records
Mortgage History
| Date | Status | Borrower | Loan Amount |
|---|---|---|---|
| Open | Ly Phung K | $625,000 | |
| Closed | Ly Phung K | $500,000 | |
| Closed | Ly Phung K | $431,850 |
Source: Public Records
Tax History Compared to Growth
Tax History
| Year | Tax Paid | Tax Assessment Tax Assessment Total Assessment is a certain percentage of the fair market value that is determined by local assessors to be the total taxable value of land and additions on the property. | Land | Improvement |
|---|---|---|---|---|
| 2025 | $13,084 | $902,289 | $272,901 | $636,388 |
| 2024 | $13,084 | $884,464 | $267,551 | $623,913 |
| 2023 | $12,697 | $873,984 | $262,305 | $611,679 |
| 2022 | $12,489 | $849,851 | $257,163 | $599,688 |
| 2021 | $12,212 | $833,055 | $252,122 | $587,933 |
| 2020 | $11,948 | $831,446 | $249,538 | $581,908 |
| 2019 | $12,057 | $815,144 | $244,646 | $570,498 |
| 2018 | $11,782 | $799,161 | $239,849 | $559,312 |
| 2017 | $11,504 | $783,491 | $235,146 | $548,345 |
| 2016 | $11,093 | $768,129 | $230,535 | $537,594 |
| 2015 | $10,887 | $756,590 | $227,072 | $529,518 |
| 2014 | $10,488 | $741,772 | $222,625 | $519,147 |
Source: Public Records
Map
Nearby Homes
- 126 Bellflower Ln
- 34237 Torrey Pine Ln
- 1020 Carnelian Terrace
- 35005 11th St
- 213 Ladera Plaza Unit 13
- 365 Monaco Ave
- 208 Appian Way
- 352 Monte Carlo Ave
- 217 Appian Way
- 33852 11th St
- 33718 3rd St
- 33848 10th St
- 33840 10th St
- 33853 10th St
- 35180 Mount Whitney Terrace
- 902 G St
- 35560 Monterra Terrace Unit 301
- 33603 3rd St
- 33548 4th St
- 33846 14th St
- 34349 Torrey Pine Ln
- 34341 Torrey Pine Ln
- 122 Bellflower Ln
- 130 Bellflower Ln
- 34353 Torrey Pine Ln
- 34337 Torrey Pine Ln
- 134 Bellflower Ln
- 34368 Torrey Pine Ln
- 34333 Torrey Pine Ln
- 34449 Willow Ln
- 34357 Torrey Pine Ln
- 34445 Willow Ln
- 138 Bellflower Ln
- 34453 Willow Ln
- 121 Bellflower Ln
- 34364 Torrey Pine Ln
- 34441 Willow Ln
- 34361 Torrey Pine Ln
- 34457 Willow Ln
- 34329 Torrey Pine Ln