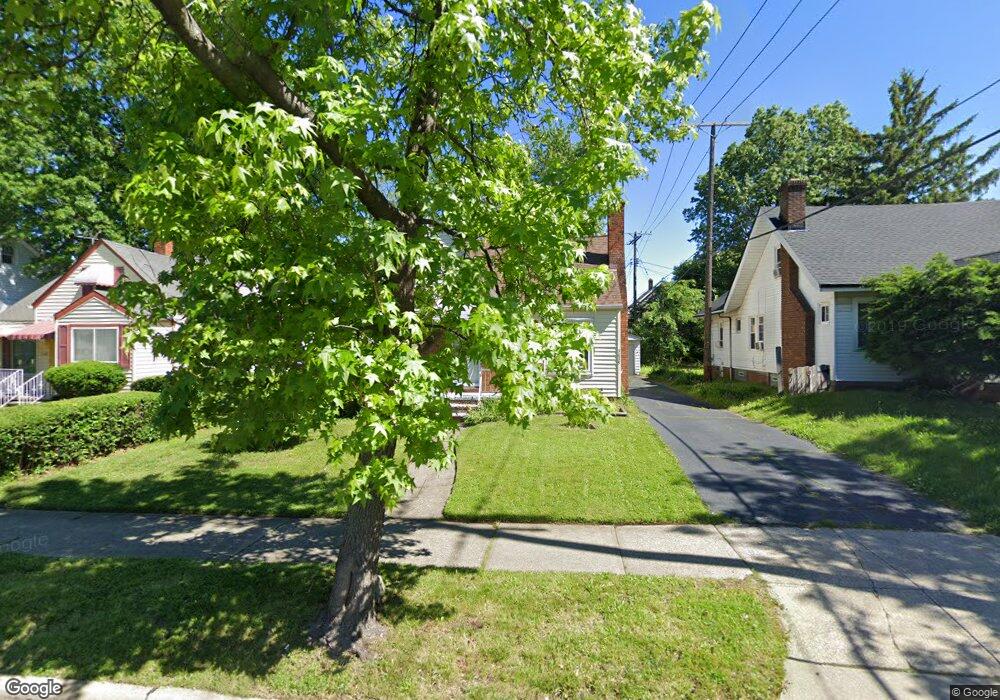
3435 Berkeley Rd Cleveland, OH 44118
Estimated Value: $109,958 - $187,000
3
Beds
1
Bath
1,286
Sq Ft
$111/Sq Ft
Est. Value
About This Home
This home is located at 3435 Berkeley Rd, Cleveland, OH 44118 and is currently estimated at $142,240, approximately $110 per square foot. 3435 Berkeley Rd is a home located in Cuyahoga County with nearby schools including Boulevard Elementary School, Roxboro Middle School, and Cleveland Heights High School.
Ownership History
Date
Name
Owned For
Owner Type
Purchase Details
Closed on
Mar 25, 2022
Sold by
Yes Homes Llc
Bought by
Cle Private Equities 2014D Llc
Current Estimated Value
Home Financials for this Owner
Home Financials are based on the most recent Mortgage that was taken out on this home.
Original Mortgage
$720,000
Outstanding Balance
$672,712
Interest Rate
3.92%
Mortgage Type
New Conventional
Estimated Equity
-$530,472
Purchase Details
Closed on
Jul 22, 2021
Sold by
Bailey Barbara F
Bought by
Yes Homes Ii Llc
Home Financials for this Owner
Home Financials are based on the most recent Mortgage that was taken out on this home.
Original Mortgage
$77,272
Interest Rate
3%
Mortgage Type
Purchase Money Mortgage
Purchase Details
Closed on
Oct 4, 1978
Sold by
Dees Arthur L
Bought by
Bailey Barbara F
Purchase Details
Closed on
Mar 26, 1976
Sold by
Greenberger Frieda
Bought by
Dees Arthur L
Purchase Details
Closed on
Jan 1, 1975
Bought by
Greenberger Frieda
Create a Home Valuation Report for This Property
The Home Valuation Report is an in-depth analysis detailing your home's value as well as a comparison with similar homes in the area
Home Values in the Area
Average Home Value in this Area
Purchase History
| Date | Buyer | Sale Price | Title Company |
|---|---|---|---|
| Cle Private Equities 2014D Llc | -- | Heights Title | |
| Yes Homes Ii Llc | $65,000 | Nova Title Agency Inc | |
| Bailey Barbara F | $32,000 | -- | |
| Dees Arthur L | $22,000 | -- | |
| Greenberger Frieda | -- | -- |
Source: Public Records
Mortgage History
| Date | Status | Borrower | Loan Amount |
|---|---|---|---|
| Open | Cle Private Equities 2014D Llc | $720,000 | |
| Previous Owner | Yes Homes Ii Llc | $77,272 |
Source: Public Records
Tax History Compared to Growth
Tax History
| Year | Tax Paid | Tax Assessment Tax Assessment Total Assessment is a certain percentage of the fair market value that is determined by local assessors to be the total taxable value of land and additions on the property. | Land | Improvement |
|---|---|---|---|---|
| 2024 | $4,422 | $46,025 | $12,110 | $33,915 |
| 2023 | $4,977 | $40,920 | $10,540 | $30,380 |
| 2022 | $4,541 | $40,920 | $10,540 | $30,380 |
| 2021 | $3,447 | $40,920 | $10,540 | $30,380 |
| 2020 | $2,892 | $33,010 | $8,510 | $24,500 |
| 2019 | $2,734 | $94,300 | $24,300 | $70,000 |
| 2018 | $2,736 | $33,010 | $8,510 | $24,500 |
| 2017 | $2,419 | $28,600 | $8,020 | $20,580 |
| 2016 | $2,415 | $28,600 | $8,020 | $20,580 |
| 2015 | $3,807 | $28,600 | $8,020 | $20,580 |
| 2014 | $3,807 | $30,770 | $8,610 | $22,160 |
Source: Public Records
Map
Nearby Homes
- 3484 Berkeley Rd
- 3484 Bainbridge Rd
- 3365 Desota Ave
- 3388 Beechwood Ave Unit 2
- 3521 Berkeley Rd
- 3496 Blanche Ave
- 3423 Beechwood Ave
- 3383 Beechwood Ave
- 3328 Altamont Ave
- 3483 Severn Rd
- 3412 Euclid Heights Blvd
- 3537 Shannon Rd
- 3326 Beechwood Ave
- 3314 Altamont Ave
- 3559 Berkeley Rd
- 3356 Euclid Heights Blvd
- 3320 Beechwood Ave
- 1924 Janette Ave
- 3498 Cummings Rd
- 3264 Altamont Ave
- 3445 Berkeley Rd
- 3429 Berkeley Rd
- 3447 Berkeley Rd
- 3425 Berkeley Rd
- 3438 Desota Ave
- 3442 Desota Ave
- 3442 Desota Ave Unit 3
- 3432 Desota Ave
- 3421 Berkeley Rd
- 1822 S Taylor Rd
- 3428 Desota Ave
- 1828 S Taylor Rd
- 1816 S Taylor Rd
- 3438 Berkeley Rd
- 3424 Desota Ave
- 3417 Berkeley Rd
- 1812 S Taylor Rd
- 3426 Berkeley Rd
- 3420 Desota Ave
- 3422 Berkeley Rd