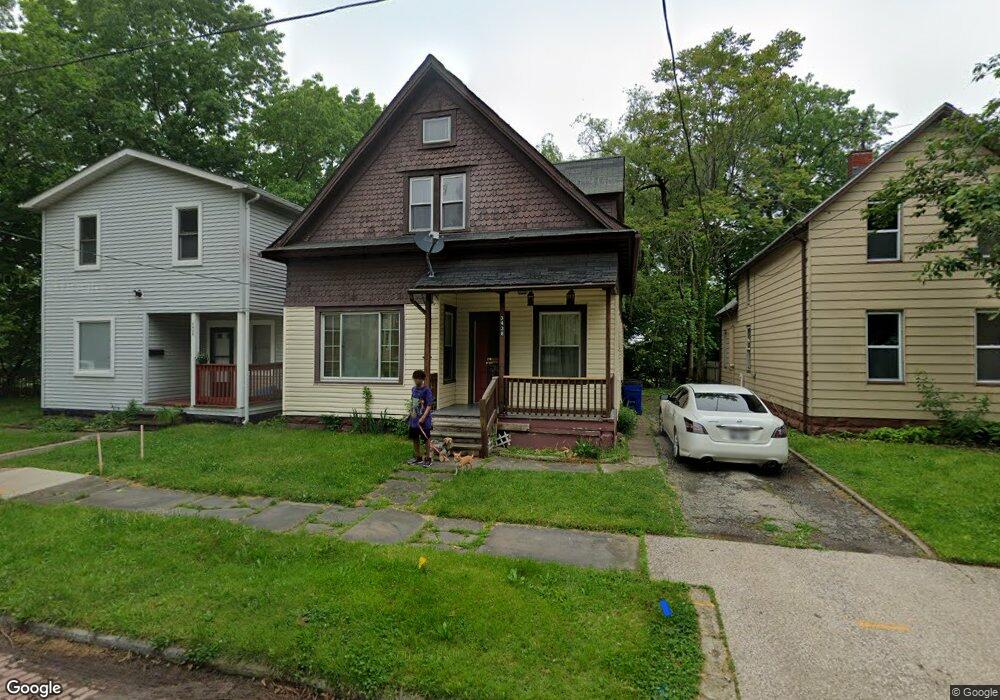
3438 Henninger Rd Cleveland, OH 44109
Old Brooklyn NeighborhoodEstimated Value: $110,000 - $190,000
3
Beds
1
Bath
1,389
Sq Ft
$99/Sq Ft
Est. Value
About This Home
This home is located at 3438 Henninger Rd, Cleveland, OH 44109 and is currently estimated at $137,233, approximately $98 per square foot. 3438 Henninger Rd is a home located in Cuyahoga County with nearby schools including Benjamin Franklin, Almira Academy, and Anton Grdina School.
Ownership History
Date
Name
Owned For
Owner Type
Purchase Details
Closed on
Oct 30, 2015
Sold by
Medley Marlene F
Bought by
Medley Marlene
Current Estimated Value
Purchase Details
Closed on
May 15, 2009
Sold by
Medley Thomas N
Bought by
Medley Thomas N and Medley Marlene F
Purchase Details
Closed on
Jun 14, 2007
Sold by
Johnson Dorothy L
Bought by
Medley Thomas N
Purchase Details
Closed on
Dec 3, 1987
Sold by
Ball Sarah C
Bought by
J E M Enterprises A General
Purchase Details
Closed on
Nov 6, 1986
Sold by
Clarence C Ball
Bought by
Ball Sarah C
Purchase Details
Closed on
Mar 29, 1985
Sold by
Kim Lee Kendzierski
Bought by
Clarence C Ball
Purchase Details
Closed on
Nov 30, 1977
Sold by
Miller James
Bought by
Ball Clarence C
Purchase Details
Closed on
Sep 3, 1976
Bought by
Miller James
Purchase Details
Closed on
Jun 2, 1976
Bought by
Admn Of Veterans Affairs
Purchase Details
Closed on
Jan 1, 1975
Bought by
Koon Roscoe O and Koon Frances L
Create a Home Valuation Report for This Property
The Home Valuation Report is an in-depth analysis detailing your home's value as well as a comparison with similar homes in the area
Home Values in the Area
Average Home Value in this Area
Purchase History
| Date | Buyer | Sale Price | Title Company |
|---|---|---|---|
| Medley Marlene | -- | None Available | |
| Medley Marlene F | -- | Attorney | |
| Medley Thomas N | -- | None Available | |
| Medley Thomas N | $10,000 | Attorney | |
| J E M Enterprises A General | $27,800 | -- | |
| Ball Sarah C | -- | -- | |
| Clarence C Ball | -- | -- | |
| Kim Lee Kendzierski | -- | -- | |
| Ball Clarence C | $27,000 | -- | |
| Miller James | -- | -- | |
| Admn Of Veterans Affairs | -- | -- | |
| Kissell Company | $14,500 | -- | |
| Koon Roscoe O | -- | -- |
Source: Public Records
Tax History Compared to Growth
Tax History
| Year | Tax Paid | Tax Assessment Tax Assessment Total Assessment is a certain percentage of the fair market value that is determined by local assessors to be the total taxable value of land and additions on the property. | Land | Improvement |
|---|---|---|---|---|
| 2024 | $1,711 | $25,585 | $7,560 | $18,025 |
| 2023 | $1,319 | $17,010 | $5,180 | $11,830 |
| 2022 | $1,311 | $17,010 | $5,180 | $11,830 |
| 2021 | $1,299 | $17,010 | $5,180 | $11,830 |
| 2020 | $1,166 | $13,200 | $4,030 | $9,170 |
| 2019 | $1,080 | $37,700 | $11,500 | $26,200 |
| 2018 | $1,139 | $13,200 | $4,030 | $9,170 |
| 2017 | $1,211 | $14,320 | $3,150 | $11,170 |
| 2016 | $1,202 | $14,320 | $3,150 | $11,170 |
| 2015 | $1,201 | $14,320 | $3,150 | $11,170 |
| 2014 | $2,031 | $15,890 | $3,500 | $12,390 |
Source: Public Records
Map
Nearby Homes
- 3529 Broadview Rd
- 3923 Pensacola Ave
- 3810 Memphis Ave
- 3900 W 33rd St
- 4229 W 23rd St
- 4295 W 30th St
- 4302 W 30th St
- 3613 Henritze Ave
- 4249 W 23rd St
- 3890 W 36th St
- 3909 Memphis Ave
- 2802 Colburn Ave
- 3888 W 37th St
- 4267 W 21st St
- 3821 Spokane Ave
- 3947 W 22nd St
- 3847 W 38th St
- 4102 Spokane Ave
- 2312 Roanoke Ave Unit 1-2
- 3817 Denison Ave
- 3434 Henninger Rd
- 3440 Henninger Rd
- 3430 Henninger Rd
- 3426 Henninger Rd
- 3435 Henninger Rd
- 3439 Henninger Rd
- 3431 Henninger Rd
- 3443 Henninger Rd
- 3427 Henninger Rd
- 3447 Henninger Rd
- 3423 Henninger Rd
- 4100 Pearl Rd
- 3421 Henninger Rd
- 3451 Henninger Rd
- 3417 Henninger Rd
- 3438 Krather Rd
- 3442 Krather Rd
- 3442 Krather Rd Unit Down
- 3434 Krather Rd
- 3500 Krather Rd