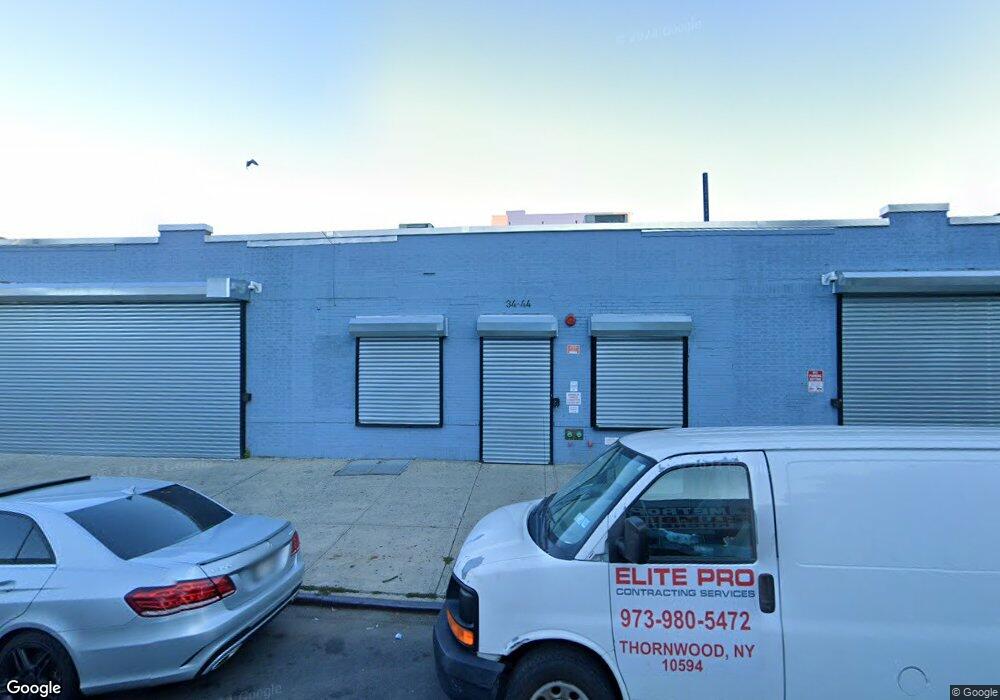
3444 Steinway St Long Island City, NY 11101
Astoria NeighborhoodEstimated Value: $1,611,581
--
Bed
--
Bath
5,365
Sq Ft
$300/Sq Ft
Est. Value
About This Home
This home is located at 3444 Steinway St, Long Island City, NY 11101 and is currently estimated at $1,611,581, approximately $300 per square foot. 3444 Steinway St is a home located in Queens County with nearby schools including P.S. 166Q The Henry Gradstein School, I.S. 204 Oliver W. Holmes, and William Cullen Bryant High School.
Ownership History
Date
Name
Owned For
Owner Type
Purchase Details
Closed on
Dec 8, 2010
Sold by
Weinstock Lamp Co Inc
Bought by
Geffen Enterprises Llc
Current Estimated Value
Home Financials for this Owner
Home Financials are based on the most recent Mortgage that was taken out on this home.
Original Mortgage
$495,000
Outstanding Balance
$328,751
Interest Rate
4.4%
Mortgage Type
Commercial
Estimated Equity
$1,302,551
Purchase Details
Closed on
Apr 12, 1999
Sold by
Hinsch Howard H
Bought by
Weinstock Lamp Co Inc
Purchase Details
Closed on
Jan 12, 1995
Sold by
Hinsch Howard H
Bought by
Hinsch Howard H and Hinsch Gloria F
Create a Home Valuation Report for This Property
The Home Valuation Report is an in-depth analysis detailing your home's value as well as a comparison with similar homes in the area
Home Values in the Area
Average Home Value in this Area
Purchase History
| Date | Buyer | Sale Price | Title Company |
|---|---|---|---|
| Geffen Enterprises Llc | $900,000 | -- | |
| Geffen Enterprises Llc | $900,000 | -- | |
| Weinstock Lamp Co Inc | $840,750 | First American Title Ins Co | |
| Weinstock Lamp Co Inc | $840,750 | First American Title Ins Co | |
| Hinsch Howard H | -- | First American Title Ins Co | |
| Hinsch Howard H | -- | First American Title Ins Co |
Source: Public Records
Mortgage History
| Date | Status | Borrower | Loan Amount |
|---|---|---|---|
| Open | Geffen Enterprises Llc | $495,000 | |
| Closed | Geffen Enterprises Llc | $495,000 |
Source: Public Records
Tax History Compared to Growth
Tax History
| Year | Tax Paid | Tax Assessment Tax Assessment Total Assessment is a certain percentage of the fair market value that is determined by local assessors to be the total taxable value of land and additions on the property. | Land | Improvement |
|---|---|---|---|---|
| 2025 | $102,001 | $995,620 | $294,750 | $700,870 |
| 2024 | $102,001 | $963,000 | $294,750 | $668,250 |
| 2023 | $111,707 | $1,054,640 | $294,750 | $759,890 |
| 2022 | $116,290 | $1,101,600 | $294,750 | $806,850 |
| 2021 | $98,315 | $919,350 | $294,750 | $624,600 |
| 2020 | $117,242 | $1,149,300 | $294,750 | $854,550 |
| 2019 | $102,556 | $1,115,100 | $294,750 | $820,350 |
| 2018 | $93,825 | $855,990 | $294,750 | $561,240 |
| 2017 | $39,729 | $724,680 | $294,750 | $429,930 |
| 2016 | $62,886 | $724,680 | $294,750 | $429,930 |
| 2015 | $22,956 | $484,560 | $294,750 | $189,810 |
| 2014 | $22,956 | $485,550 | $294,750 | $190,800 |
Source: Public Records
Map
Nearby Homes
- 32-87 38th St
- 3284 36th St
- 3268 42nd St
- 3218 42nd St
- 32-86 33rd St Unit F8
- 31-73 41st St
- 32-29 44th St
- 3145 37th St Unit 3
- 35-34 31st St
- 31-74 33rd St
- 31-61 43rd St
- 36-11 31st St
- 36-09 31st St
- 31-42 34th St Unit MultiFamily
- 31-71 32nd St
- 31-49 33rd St
- 31-20 41st St
- 36-44 32nd St
- 37-14 34th St Unit N-3E
- 37-14 34th St Unit S4G
- 3430 Steinway St
- 3435 38th St
- 3450 Steinway St
- 3426 Steinway St
- 34-26 Steinway St
- 34-26 Steinway St Unit 9
- 34-26 Steinway St Unit 17
- 34-26 Steinway St Unit 2
- 3427 Steinway St
- 3427 Steinway St
- 3427 Steinway St
- 3801 35th Ave
- 3429 Steinway St
- 3449 Steinway St
- 3431 Steinway St
- 3414 Steinway St
- 3423 Steinway St
- 3421 Steinway St
- 3810 35th Ave Unit 6K
- 34-13 38th St