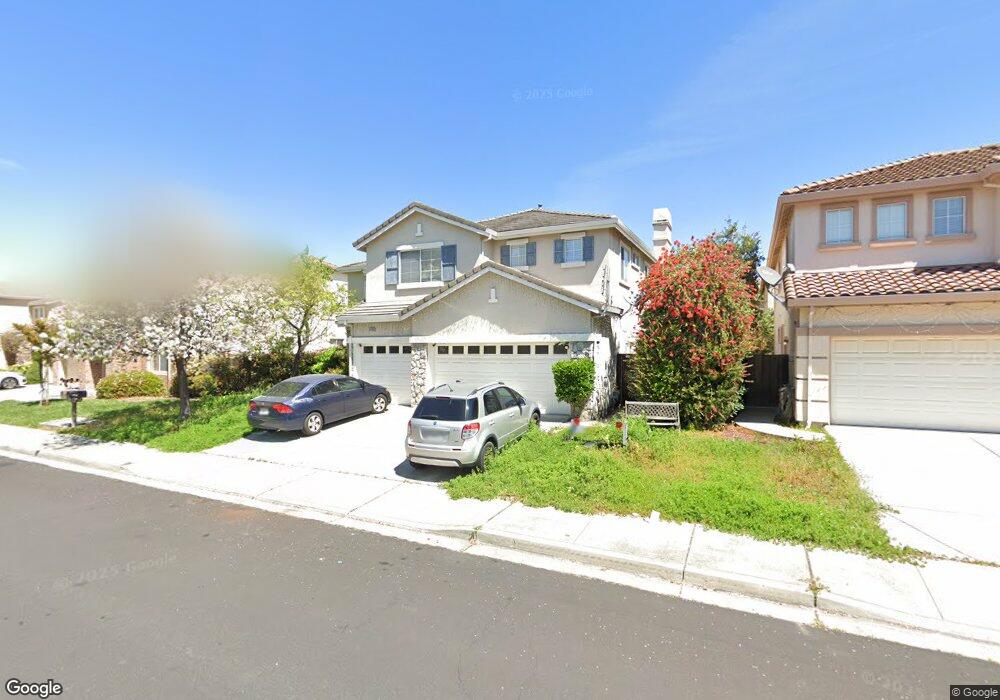
34469 Willow Ln Union City, CA 94587
Downtown Union City NeighborhoodEstimated Value: $1,563,000 - $1,964,000
5
Beds
3
Baths
2,677
Sq Ft
$664/Sq Ft
Est. Value
About This Home
This home is located at 34469 Willow Ln, Union City, CA 94587 and is currently estimated at $1,777,897, approximately $664 per square foot. 34469 Willow Ln is a home located in Alameda County with nearby schools including Guy Jr. Emanuele Elementary School, Cesar Chavez Middle School, and James Logan High School.
Ownership History
Date
Name
Owned For
Owner Type
Purchase Details
Closed on
Aug 24, 2010
Sold by
Ferrer Emma S
Bought by
Ferrer Rodolfo F and Ferrer Emma S
Current Estimated Value
Purchase Details
Closed on
Mar 2, 2010
Sold by
Ferrer Rodolfo F and Ferrer Emma S
Bought by
Ferrer Emma S
Purchase Details
Closed on
Apr 10, 2005
Sold by
Ferrer Emma S
Bought by
Ferrer Rodolfo F and Ferrer Emma S
Purchase Details
Closed on
May 25, 2004
Sold by
Ferrer Rodolfo F
Bought by
Ferrer Emma S
Home Financials for this Owner
Home Financials are based on the most recent Mortgage that was taken out on this home.
Original Mortgage
$562,500
Outstanding Balance
$271,500
Interest Rate
5.92%
Mortgage Type
New Conventional
Estimated Equity
$1,506,397
Purchase Details
Closed on
Mar 9, 1999
Sold by
Braddock & Logan Group Lp
Bought by
Ferrer Rodolfo F and Ferrer Emma S
Home Financials for this Owner
Home Financials are based on the most recent Mortgage that was taken out on this home.
Original Mortgage
$370,900
Interest Rate
6.7%
Create a Home Valuation Report for This Property
The Home Valuation Report is an in-depth analysis detailing your home's value as well as a comparison with similar homes in the area
Home Values in the Area
Average Home Value in this Area
Purchase History
| Date | Buyer | Sale Price | Title Company |
|---|---|---|---|
| Ferrer Rodolfo F | -- | None Available | |
| Ferrer Emma S | -- | None Available | |
| Ferrer Rodolfo F | -- | -- | |
| Ferrer Emma S | -- | Chicago Title Company | |
| Ferrer Rodolfo F | $464,000 | First American Title |
Source: Public Records
Mortgage History
| Date | Status | Borrower | Loan Amount |
|---|---|---|---|
| Open | Ferrer Emma S | $562,500 | |
| Closed | Ferrer Rodolfo F | $370,900 | |
| Closed | Ferrer Rodolfo F | $46,350 |
Source: Public Records
Tax History Compared to Growth
Tax History
| Year | Tax Paid | Tax Assessment Tax Assessment Total Assessment is a certain percentage of the fair market value that is determined by local assessors to be the total taxable value of land and additions on the property. | Land | Improvement |
|---|---|---|---|---|
| 2025 | $10,872 | $719,748 | $217,272 | $509,476 |
| 2024 | $10,872 | $705,501 | $213,012 | $499,489 |
| 2023 | $10,535 | $698,533 | $208,836 | $489,697 |
| 2022 | $10,352 | $677,838 | $204,742 | $480,096 |
| 2021 | $10,123 | $664,412 | $200,728 | $470,684 |
| 2020 | $9,917 | $664,528 | $198,670 | $465,858 |
| 2019 | $9,998 | $651,500 | $194,775 | $456,725 |
| 2018 | $9,768 | $638,729 | $190,957 | $447,772 |
| 2017 | $9,537 | $626,206 | $187,213 | $438,993 |
| 2016 | $9,199 | $613,930 | $183,543 | $430,387 |
| 2015 | $9,025 | $604,710 | $180,787 | $423,923 |
| 2014 | $8,695 | $592,864 | $177,245 | $415,619 |
Source: Public Records
Map
Nearby Homes
- 126 Bellflower Ln
- 213 Ladera Plaza Unit 13
- 34237 Torrey Pine Ln
- 208 Appian Way
- 217 Appian Way
- 1020 Carnelian Terrace
- 35005 11th St
- 352 Monte Carlo Ave
- 35180 Mount Whitney Terrace
- 35560 Monterra Terrace Unit 301
- 1157 Silver St
- 33852 11th St
- 394 Appian Way
- 33848 10th St
- 33718 3rd St
- 33840 10th St
- 33853 10th St
- 902 G St
- 315 Springstone Dr
- 33603 3rd St
- 34473 Willow Ln
- 34465 Willow Ln
- 34468 Valley Oaks Loop
- 34464 Valley Oaks Loop
- 34472 Valley Oaks Loop
- 34477 Willow Ln
- 34461 Willow Ln
- 34460 Valley Oaks Loop
- 34476 Valley Oaks Loop
- 34365 Torrey Pine Ln
- 34369 Torrey Pine Ln
- 34409 Torrey Pine Ln
- 34481 Willow Ln
- 34457 Willow Ln
- 34361 Torrey Pine Ln
- 34413 Torrey Pine Ln
- 34480 Valley Oaks Loop
- 34456 Valley Oaks Loop
- 34357 Torrey Pine Ln
- 34373 Torrey Pine Ln