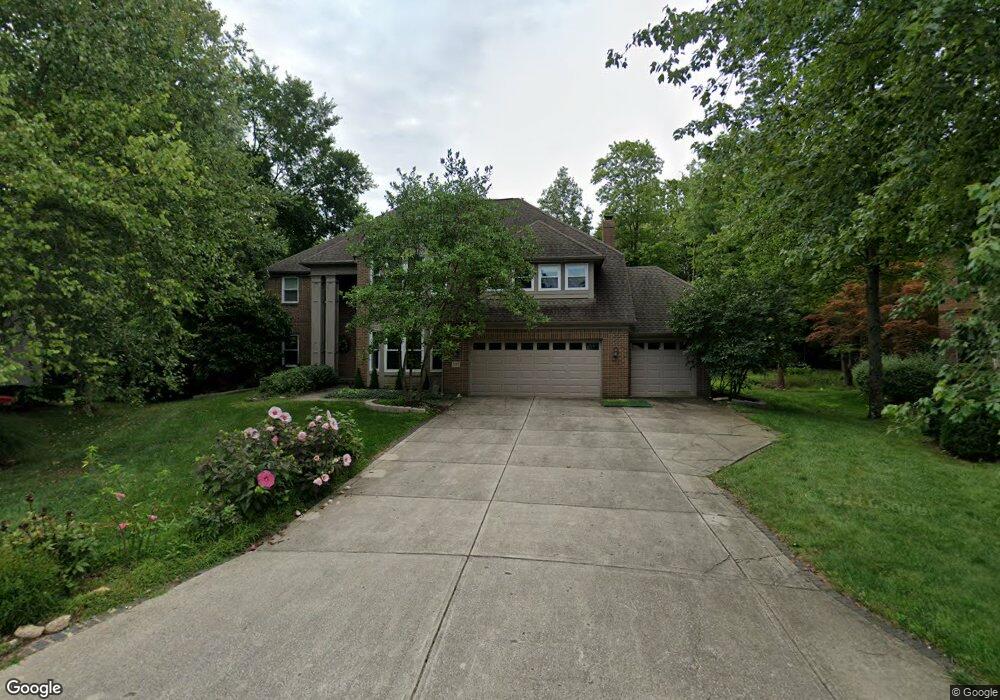
345 Rosewood Ct Powell, OH 43065
Liberty Township NeighborhoodEstimated Value: $746,149 - $887,000
4
Beds
4
Baths
3,636
Sq Ft
$222/Sq Ft
Est. Value
About This Home
This home is located at 345 Rosewood Ct, Powell, OH 43065 and is currently estimated at $805,537, approximately $221 per square foot. 345 Rosewood Ct is a home located in Delaware County with nearby schools including Tyler Run Elementary School, Olentangy Liberty Middle School, and Olentangy Liberty High School.
Ownership History
Date
Name
Owned For
Owner Type
Purchase Details
Closed on
Jan 4, 2007
Sold by
Relocation Advantage Llc
Bought by
Relocation Advantage Llc
Current Estimated Value
Purchase Details
Closed on
Apr 3, 2006
Sold by
Lesser Steven J and Lesser Danielle L
Bought by
Relocation Advantage Llc
Purchase Details
Closed on
May 1, 2001
Sold by
Russell Allen P
Bought by
Lesser Steven J and Lesser Danielle L
Home Financials for this Owner
Home Financials are based on the most recent Mortgage that was taken out on this home.
Original Mortgage
$324,000
Interest Rate
7.03%
Mortgage Type
New Conventional
Purchase Details
Closed on
Jan 30, 1998
Sold by
Glandorf Gerald J
Bought by
Prince Colleen R and Russell Allen P
Home Financials for this Owner
Home Financials are based on the most recent Mortgage that was taken out on this home.
Original Mortgage
$227,150
Interest Rate
7.16%
Mortgage Type
New Conventional
Purchase Details
Closed on
Feb 14, 1996
Sold by
Relocation Prudential
Bought by
Glandorf Gerald J and Glandorf Patricia M
Home Financials for this Owner
Home Financials are based on the most recent Mortgage that was taken out on this home.
Original Mortgage
$207,000
Interest Rate
6.6%
Mortgage Type
New Conventional
Create a Home Valuation Report for This Property
The Home Valuation Report is an in-depth analysis detailing your home's value as well as a comparison with similar homes in the area
Home Values in the Area
Average Home Value in this Area
Purchase History
| Date | Buyer | Sale Price | Title Company |
|---|---|---|---|
| Relocation Advantage Llc | $387,500 | Mtc | |
| Relocation Advantage Llc | $445,000 | Mtc | |
| Lesser Steven J | $405,000 | -- | |
| Prince Colleen R | $379,000 | -- | |
| Glandorf Gerald J | $322,500 | -- |
Source: Public Records
Mortgage History
| Date | Status | Borrower | Loan Amount |
|---|---|---|---|
| Previous Owner | Lesser Steven J | $324,000 | |
| Previous Owner | Prince Colleen R | $227,150 | |
| Previous Owner | Glandorf Gerald J | $207,000 |
Source: Public Records
Tax History Compared to Growth
Tax History
| Year | Tax Paid | Tax Assessment Tax Assessment Total Assessment is a certain percentage of the fair market value that is determined by local assessors to be the total taxable value of land and additions on the property. | Land | Improvement |
|---|---|---|---|---|
| 2024 | $11,755 | $234,150 | $39,480 | $194,670 |
| 2023 | $11,834 | $234,150 | $39,480 | $194,670 |
| 2022 | $10,113 | $161,180 | $26,950 | $134,230 |
| 2021 | $10,189 | $161,180 | $26,950 | $134,230 |
| 2020 | $10,439 | $161,180 | $26,950 | $134,230 |
| 2019 | $9,988 | $154,770 | $26,950 | $127,820 |
| 2018 | $9,870 | $154,770 | $26,950 | $127,820 |
| 2017 | $4,969 | $159,710 | $26,150 | $133,560 |
| 2016 | $10,919 | $159,710 | $26,150 | $133,560 |
| 2015 | $9,939 | $159,710 | $26,150 | $133,560 |
| 2014 | $10,399 | $159,710 | $26,150 | $133,560 |
| 2013 | $9,855 | $153,340 | $26,150 | $127,190 |
Source: Public Records
Map
Nearby Homes
- 274 Stamford Dr
- 261 Andover Dr
- 91 Tiller Dr
- 255 Winter Hill Place
- 55 Timber Oak Ct
- 87 Murphys Oval Unit N87
- 1937 Liberty St
- 120 S Liberty St
- 11 Murphys View Place
- 10053 Juliana Cir Unit 10053
- 67 Traditions Way
- 6615 Scioto St
- 6583 Scioto St
- 6601 Scioto St
- 6555 Scioto St
- 10010 Beckford Ct
- 114 Encore Park Bend
- Irving Plan at Encore Park of Powell - Uptown Collection
- Oakley Plan at Encore Park of Powell - Uptown Collection
- 110 Encore Park Bend
- 353 Rosewood Ct
- 306 Vinwood Ln
- 344 Rosewood Ct
- 302 Vinwood Ln
- 310 Vinwood Ln
- 357 Rosewood Ct
- 298 Vinwood Ln
- 316 Vinwood Ln
- 326 Vinwood Ln
- 348 Vinwood Ln
- 346 Rosewood Ct
- 362 Vinwood Ln
- 369 Rosewood Ct
- 294 Vinwood Ln
- 356 Rosewood Ct
- 376 Vinwood Ln
- 388 Vinwood Ln
- 290 Vinwood Ln
- 364 Rosewood Ct
- 305 Vinwood Ln