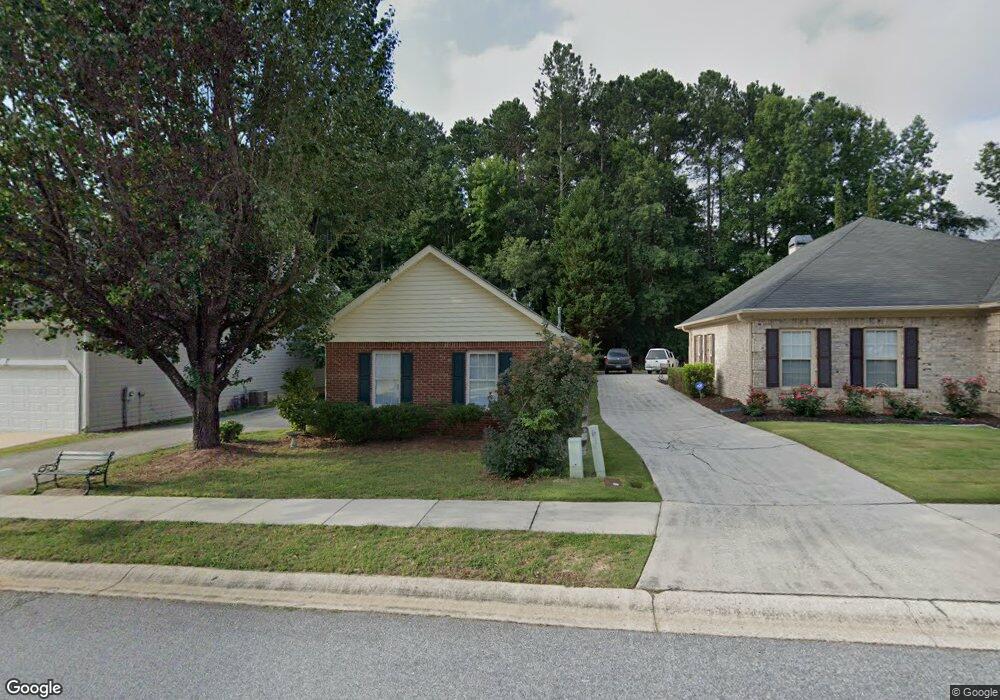
345 Woodgate Dr Fayetteville, GA 30214
Estimated Value: $303,859 - $326,000
--
Bed
2
Baths
1,423
Sq Ft
$220/Sq Ft
Est. Value
About This Home
This home is located at 345 Woodgate Dr, Fayetteville, GA 30214 and is currently estimated at $312,465, approximately $219 per square foot. 345 Woodgate Dr is a home located in Fayette County with nearby schools including Spring Hill Elementary School, Bennett's Mill Middle School, and Fayette County High School.
Ownership History
Date
Name
Owned For
Owner Type
Purchase Details
Closed on
Sep 20, 2017
Sold by
Young Katherine Garrard Es
Bought by
Young Paul G and Matthews Kaydee Young
Current Estimated Value
Home Financials for this Owner
Home Financials are based on the most recent Mortgage that was taken out on this home.
Original Mortgage
$58,000
Outstanding Balance
$39,966
Interest Rate
3.86%
Mortgage Type
New Conventional
Estimated Equity
$272,499
Purchase Details
Closed on
Apr 24, 2017
Sold by
Yound Paul Garrard
Bought by
Young Katherine Garrard Estate and Matthews Kaydee Young Executor
Purchase Details
Closed on
May 11, 1993
Sold by
Kovach Brian C and Kahl Shannon A
Bought by
Young Paul G and Young Katherine G
Home Financials for this Owner
Home Financials are based on the most recent Mortgage that was taken out on this home.
Original Mortgage
$87,138
Interest Rate
7.57%
Mortgage Type
FHA
Create a Home Valuation Report for This Property
The Home Valuation Report is an in-depth analysis detailing your home's value as well as a comparison with similar homes in the area
Home Values in the Area
Average Home Value in this Area
Purchase History
| Date | Buyer | Sale Price | Title Company |
|---|---|---|---|
| Young Paul G | -- | -- | |
| Young Katherine Garrard Estate | -- | -- | |
| Young Paul G | $88,500 | -- |
Source: Public Records
Mortgage History
| Date | Status | Borrower | Loan Amount |
|---|---|---|---|
| Open | Young Paul G | $58,000 | |
| Previous Owner | Young Paul G | $87,138 |
Source: Public Records
Tax History Compared to Growth
Tax History
| Year | Tax Paid | Tax Assessment Tax Assessment Total Assessment is a certain percentage of the fair market value that is determined by local assessors to be the total taxable value of land and additions on the property. | Land | Improvement |
|---|---|---|---|---|
| 2024 | $1,159 | $116,728 | $46,640 | $70,088 |
| 2023 | $979 | $113,320 | $46,640 | $66,680 |
| 2022 | $832 | $82,360 | $16,000 | $66,360 |
| 2021 | $714 | $71,240 | $16,000 | $55,240 |
| 2020 | $651 | $63,840 | $12,800 | $51,040 |
| 2019 | $634 | $61,560 | $12,800 | $48,760 |
| 2018 | $583 | $56,840 | $12,800 | $44,040 |
| 2017 | $449 | $52,480 | $12,800 | $39,680 |
| 2016 | $433 | $48,760 | $12,800 | $35,960 |
| 2015 | $383 | $42,440 | $12,800 | $29,640 |
| 2014 | $369 | $39,520 | $12,800 | $26,720 |
| 2013 | -- | $39,840 | $0 | $0 |
Source: Public Records
Map
Nearby Homes
- 235 Woodstream Way
- 170 Woodstream Way Unit B
- 415 Williamsburg Way
- The Bradford Plan at Mitchell Estates
- The Mildred Plan at Mitchell Estates
- 110 Lindsey Terrace
- 130 Thrushwood Dr
- 315 Ivanhoe Dr
- 160 Hunters Ln Unit A - D
- 175 Annelle Park Dr
- 500 Dickson Springs Rd
- 135 Knights Ct
- 665 Beauregard Blvd
- 230 Wyngate Cir
- 175 Keaton Dr
- 155 Medford Dr
- 210 Pecan Ridge Dr Unit 2
- 110 Sparrows Cove
- 140 Reese St
- 130 Reese St
- 355 Woodgate Dr
- 335 Woodgate Dr Unit LOT 24B
- 335 Woodgate Dr
- 365 Woodgate Dr
- 365 Woodgate Dr Unit 2
- 365 Woodgate Dr Unit 27
- 325 Woodgate Dr Unit 23
- 325 Woodgate Dr
- 315 Woodgate Dr
- 320 Woodgate Dr
- 330 Woodgate Dr
- 340 Woodgate Dr
- 255 Woodstream Way
- 350 Woodgate Dr Unit 37
- 310 Woodgate Dr
- 305 Woodgate Dr
- 300 Woodgate Dr
- 290 Woodgate Dr
- 280 Woodstream Way
- 280 Woodgate Dr