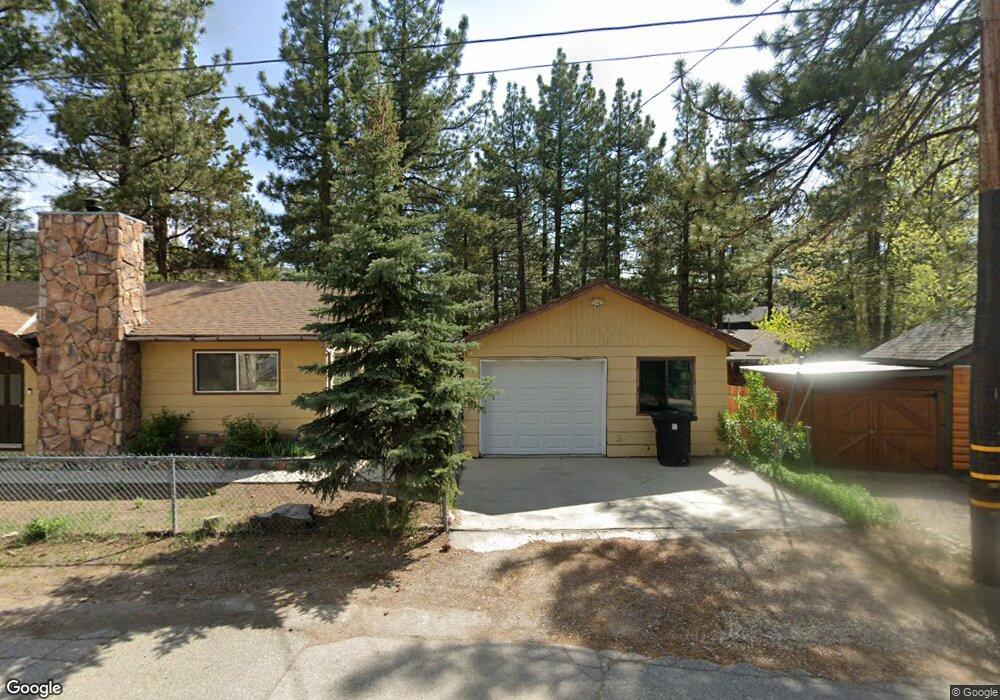
346 W North Shore Dr Big Bear City, CA 92314
Estimated Value: $335,000 - $376,000
2
Beds
1
Bath
1,080
Sq Ft
$331/Sq Ft
Est. Value
About This Home
This home is located at 346 W North Shore Dr, Big Bear City, CA 92314 and is currently estimated at $357,345, approximately $330 per square foot. 346 W North Shore Dr is a home located in San Bernardino County with nearby schools including North Shore Elementary School, Big Bear Middle School, and Big Bear High School.
Ownership History
Date
Name
Owned For
Owner Type
Purchase Details
Closed on
Jan 30, 2004
Sold by
Sandoval Frank and Sandoval Helen
Bought by
Sandoval Frank and Sandoval Helen
Current Estimated Value
Purchase Details
Closed on
Aug 13, 2003
Sold by
Stefano Anthony J and Stefano Dolores M
Bought by
Sandoval Frank and Sandoval Helen
Purchase Details
Closed on
Jun 14, 2001
Sold by
Kohler Norma
Bought by
Stefano Anthony J and Stefano Dolores
Home Financials for this Owner
Home Financials are based on the most recent Mortgage that was taken out on this home.
Original Mortgage
$134,436
Interest Rate
7.15%
Mortgage Type
VA
Purchase Details
Closed on
Jun 4, 1999
Sold by
Linhart Francis E
Bought by
Kohler Robert and Kohler Norma
Create a Home Valuation Report for This Property
The Home Valuation Report is an in-depth analysis detailing your home's value as well as a comparison with similar homes in the area
Home Values in the Area
Average Home Value in this Area
Purchase History
| Date | Buyer | Sale Price | Title Company |
|---|---|---|---|
| Sandoval Frank | -- | -- | |
| Sandoval Frank | -- | Stewart Title Company | |
| Stefano Anthony J | $132,000 | First American Title | |
| Kohler Robert | $115,000 | Universal Title Company |
Source: Public Records
Mortgage History
| Date | Status | Borrower | Loan Amount |
|---|---|---|---|
| Previous Owner | Stefano Anthony J | $134,436 |
Source: Public Records
Tax History Compared to Growth
Tax History
| Year | Tax Paid | Tax Assessment Tax Assessment Total Assessment is a certain percentage of the fair market value that is determined by local assessors to be the total taxable value of land and additions on the property. | Land | Improvement |
|---|---|---|---|---|
| 2025 | $3,401 | $216,115 | $42,654 | $173,461 |
| 2024 | $3,401 | $211,878 | $41,818 | $170,060 |
| 2023 | $3,298 | $207,723 | $40,998 | $166,725 |
| 2022 | $3,175 | $203,650 | $40,194 | $163,456 |
| 2021 | $3,107 | $199,657 | $39,406 | $160,251 |
| 2020 | $3,116 | $197,610 | $39,002 | $158,608 |
| 2019 | $3,071 | $193,735 | $38,237 | $155,498 |
| 2018 | $2,957 | $189,936 | $37,487 | $152,449 |
| 2017 | $2,878 | $186,212 | $36,752 | $149,460 |
| 2016 | $2,808 | $182,560 | $36,031 | $146,529 |
| 2015 | $2,766 | $179,818 | $35,490 | $144,328 |
| 2014 | $2,712 | $176,296 | $34,795 | $141,501 |
Source: Public Records
Map
Nearby Homes
- 937 Michael Ave
- 964 Michael Ave
- 936 Michael Ave
- 929 Peter Ave
- 1009 Myrtle Ave
- 375 W Tiger Lily Dr
- 1005 Nana Ave
- 1017 Nana Ave
- 912 Tinkerbell Ave
- 109 W Meadow Ln
- 936 Wendy Ave
- 1017 Greenway Dr
- 945 Greenway Dr
- 332 W Meadow Ln
- 209 W Meadow Ln
- 1101 Nana Ave
- 171 W Meadow Ln
- 921 Wendy Ave
- 924 Greenway Dr
- 1109 Holden Ave
- 342 W North Shore Dr
- 360 W North Shore Dr
- 338 W North Shore Dr
- 952 Peter Ave
- 364 W North Shore Dr
- 961 Michael Ave
- 965 Michael Ave
- 957 Michael Ave
- 368 W North Shore Dr
- 330 W North Shore Dr
- 369 W North Shore Dr
- 949 Peter Ave
- 377 W North Shore Dr
- 953 Michael Ave
- 377 W North Shore Dr
- 365 W North Shore Dr
- 361 W North Shore Dr
- 949 Michael Ave
- 944 Peter Ave
- 970 Tinkerbell Ave