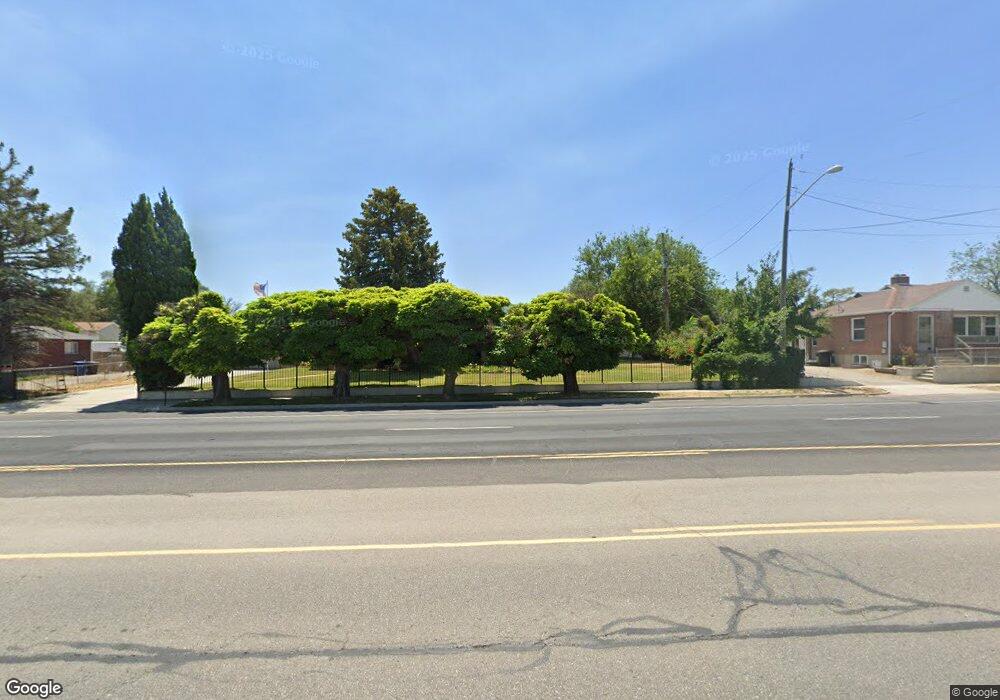
3487 W 4700 S Salt Lake City, UT 84129
Estimated Value: $547,000 - $688,000
4
Beds
3
Baths
2,722
Sq Ft
$219/Sq Ft
Est. Value
About This Home
This home is located at 3487 W 4700 S, Salt Lake City, UT 84129 and is currently estimated at $595,586, approximately $218 per square foot. 3487 W 4700 S is a home located in Salt Lake County with nearby schools including Arcadia Elementary School, Bennion Junior High School, and Taylorsville High School.
Ownership History
Date
Name
Owned For
Owner Type
Purchase Details
Closed on
Nov 17, 2017
Sold by
Norman Michael T
Bought by
Norman Michael T and Norman Sharee B
Current Estimated Value
Purchase Details
Closed on
Mar 23, 2015
Sold by
Norman Lorraine
Bought by
Norman Lorraine and Norman Michael T
Home Financials for this Owner
Home Financials are based on the most recent Mortgage that was taken out on this home.
Original Mortgage
$50,000
Outstanding Balance
$38,253
Interest Rate
3.65%
Mortgage Type
Commercial
Estimated Equity
$557,333
Purchase Details
Closed on
Mar 10, 1995
Sold by
Bradshaw Alexander B and Bradshaw Alex
Bought by
Norman Russell E and Norman Lorraine
Purchase Details
Closed on
Apr 5, 1994
Sold by
Jones Asael S and Jones Rossine W
Bought by
Bradshaw Alexander B and Lynnette Bradshaw C
Create a Home Valuation Report for This Property
The Home Valuation Report is an in-depth analysis detailing your home's value as well as a comparison with similar homes in the area
Home Values in the Area
Average Home Value in this Area
Purchase History
| Date | Buyer | Sale Price | Title Company |
|---|---|---|---|
| Norman Michael T | -- | None Available | |
| Norman Lorraine | -- | Meridian Title | |
| Norman Russell E | -- | -- | |
| Norman Russell E | -- | -- | |
| Norman Russell E | -- | -- | |
| Bradshaw Alexander B | -- | -- | |
| Bradshaw Alexander B | -- | -- | |
| Bradshaw Alexander B | -- | -- |
Source: Public Records
Mortgage History
| Date | Status | Borrower | Loan Amount |
|---|---|---|---|
| Open | Norman Lorraine | $50,000 |
Source: Public Records
Tax History Compared to Growth
Tax History
| Year | Tax Paid | Tax Assessment Tax Assessment Total Assessment is a certain percentage of the fair market value that is determined by local assessors to be the total taxable value of land and additions on the property. | Land | Improvement |
|---|---|---|---|---|
| 2025 | $3,917 | $486,700 | $195,800 | $290,900 |
| 2024 | $3,917 | $475,700 | $185,200 | $290,500 |
| 2023 | $2,683 | $431,600 | $178,100 | $253,500 |
| 2022 | $3,005 | $429,500 | $174,700 | $254,800 |
| 2021 | $2,981 | $360,200 | $134,400 | $225,800 |
| 2020 | $2,497 | $317,200 | $122,900 | $194,300 |
| 2019 | $2,632 | $310,700 | $114,100 | $196,600 |
| 2018 | $2,716 | $296,400 | $114,100 | $182,300 |
| 2017 | $185 | $234,100 | $114,100 | $120,000 |
| 2016 | $170 | $226,600 | $114,100 | $112,500 |
| 2015 | $233 | $206,700 | $120,200 | $86,500 |
| 2014 | $134 | $185,800 | $109,900 | $75,900 |
Source: Public Records
Map
Nearby Homes
- 3507 W 4700 S
- 3546 W Franco Ct Unit 3
- 4624 S Harrisonwood Cir
- 3657 W 4700 S Unit A
- 3288 W 4700 S
- 3639 W Jasmine St
- 3692 Jasmine St
- 3238 W 4630 S
- 3506 4970 S
- 3574 W Kathy Ave
- 3838 W Kinglassie Ln
- 3839 W Mossmorran Ln
- 3844 W Gartmore Ln Unit 208
- 3055 Westcove Dr
- 4392 S 3680 W
- 4414 S 3200 W
- 4389 S 3760 W
- 5161 S 3600 W
- 3947 Ridgeview Way
- 3536 W Churchwood Dr
- 3503 W 4700 S
- 3475 W 4700 S
- 3503 W 4700 S
- 3372 W Sanctuary Ct
- 4746 Dymock Cir
- 3507 W 4700 S B
- 3507 W 4700 S A
- 3507 W 4700 S B Taylorsville
- 3507 W 4700 S A Taylorsville
- 4748 Dymock Cir
- 3505 W 4700 S
- 3509 W 4700 S
- 3459 W 4700 S
- 3524 Dutch Apple Cove
- 3457 W 4700 S
- 3461 W 4700 S
- 4749 S Dymock Cir
- 4749 Dymock Cir
- 3534 W Dutch Apple Cove
- 3534 Dutch Apple Cove