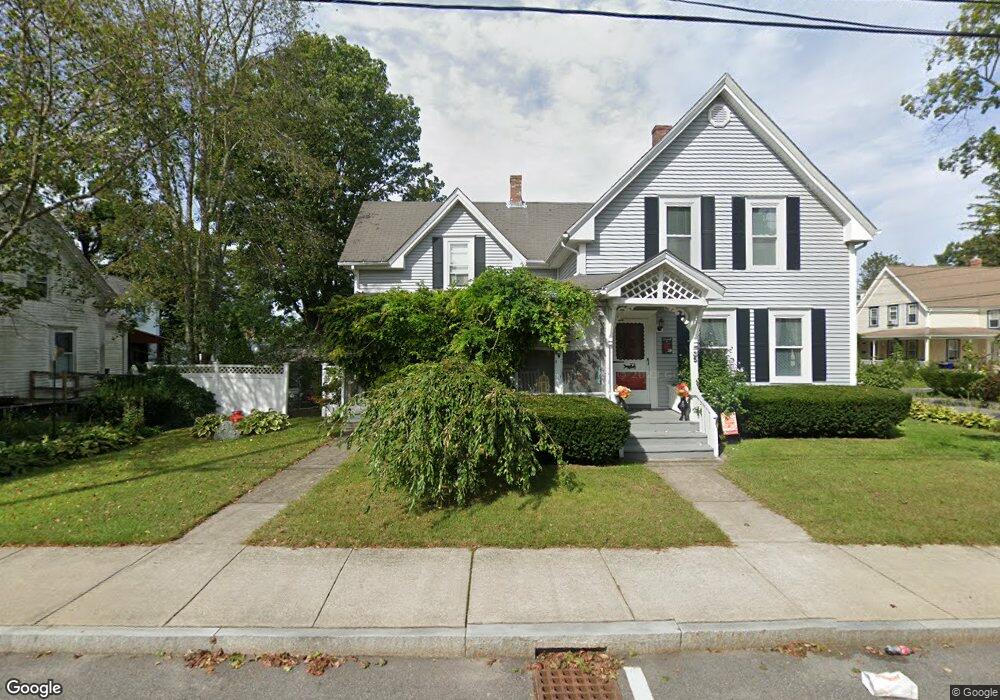
35 East St Franklin, MA 02038
Downtown Franklin NeighborhoodEstimated Value: $524,757 - $572,000
3
Beds
1
Bath
1,778
Sq Ft
$312/Sq Ft
Est. Value
About This Home
This home is located at 35 East St, Franklin, MA 02038 and is currently estimated at $554,689, approximately $311 per square foot. 35 East St is a home located in Norfolk County with nearby schools including Helen Keller Elementary School, Annie Sullivan Middle School, and Franklin High School.
Ownership History
Date
Name
Owned For
Owner Type
Purchase Details
Closed on
Jun 3, 1987
Sold by
Bullock Robert J
Bought by
Petersen Donald S
Current Estimated Value
Home Financials for this Owner
Home Financials are based on the most recent Mortgage that was taken out on this home.
Original Mortgage
$93,000
Interest Rate
10.38%
Mortgage Type
Purchase Money Mortgage
Create a Home Valuation Report for This Property
The Home Valuation Report is an in-depth analysis detailing your home's value as well as a comparison with similar homes in the area
Home Values in the Area
Average Home Value in this Area
Purchase History
| Date | Buyer | Sale Price | Title Company |
|---|---|---|---|
| Petersen Donald S | $105,000 | -- |
Source: Public Records
Mortgage History
| Date | Status | Borrower | Loan Amount |
|---|---|---|---|
| Closed | Petersen Donald S | $93,000 |
Source: Public Records
Tax History Compared to Growth
Tax History
| Year | Tax Paid | Tax Assessment Tax Assessment Total Assessment is a certain percentage of the fair market value that is determined by local assessors to be the total taxable value of land and additions on the property. | Land | Improvement |
|---|---|---|---|---|
| 2025 | $5,607 | $482,500 | $242,500 | $240,000 |
| 2024 | $5,077 | $430,600 | $242,500 | $188,100 |
| 2023 | $5,232 | $415,900 | $244,500 | $171,400 |
| 2022 | $4,947 | $352,100 | $202,000 | $150,100 |
| 2021 | $4,856 | $331,500 | $216,400 | $115,100 |
| 2020 | $4,751 | $327,400 | $218,300 | $109,100 |
| 2019 | $4,501 | $307,000 | $197,800 | $109,200 |
| 2018 | $4,404 | $300,600 | $203,400 | $97,200 |
| 2017 | $4,138 | $283,800 | $186,600 | $97,200 |
| 2016 | $3,874 | $267,200 | $183,500 | $83,700 |
| 2015 | $3,898 | $262,700 | $179,000 | $83,700 |
| 2014 | $3,383 | $234,100 | $150,400 | $83,700 |
Source: Public Records
Map
Nearby Homes
- 67 Cottage St
- 120 Union St Unit 1
- 32 Dale St
- 90 E Central St Unit 103
- 90 E Central St Unit 106
- 90 E Central St Unit 304
- 90 E Central St Unit 202
- 90 E Central St Unit 105
- 90 E Central St Unit 301
- 76 Dean Ave
- 99 Summer St
- 97 Fisher St
- 7 Howard Place
- 0 Upper Union St Unit 73230551
- 1 Pond Place
- 40 Cross St
- 374-378 Union St
- 159 E Central St
- 1 Joy St
- 417 Union St
- 39 East St
- 11-13 Church Ave
- 11 Church Ave
- 11 Church Ave Unit 1ST FLOOR
- 21 East St
- 42 East St
- 42 East St Unit 2
- 42 East St
- 15 Walnut Ave
- 43 East St
- 9 Church Ave
- 17 Church Ave
- 32 West St
- 32 West St Unit 32
- 32 West St Unit 32,32
- 34 West St
- 34 West St Unit 2
- 11 Walnut Ave
- 25 Church Ave
- 28 Church Ave Unit 1