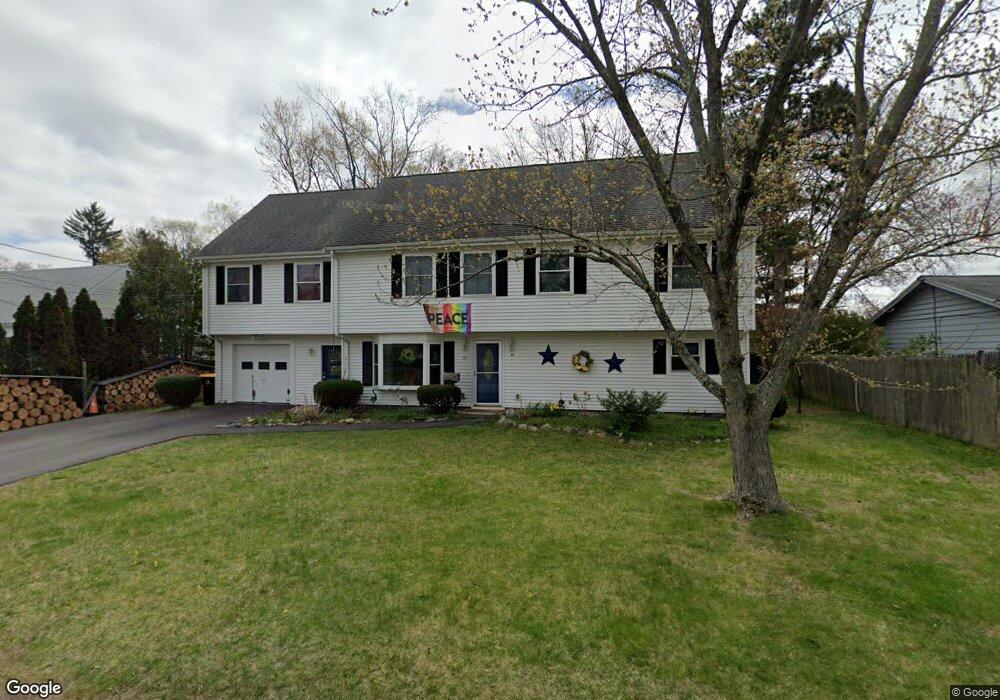
35 Fenway Dr Framingham, MA 01701
Nobscot NeighborhoodEstimated Value: $576,000 - $877,000
4
Beds
3
Baths
3,200
Sq Ft
$235/Sq Ft
Est. Value
About This Home
This home is located at 35 Fenway Dr, Framingham, MA 01701 and is currently estimated at $753,487, approximately $235 per square foot. 35 Fenway Dr is a home located in Middlesex County with nearby schools including Framingham High School, MetroWest Jewish Day School, and Saint Bridget School.
Ownership History
Date
Name
Owned For
Owner Type
Purchase Details
Closed on
Jan 14, 2025
Sold by
Pierson Stewart and Pierson Shannon L
Bought by
Pierson Ft and Pierson
Current Estimated Value
Purchase Details
Closed on
Jul 29, 1999
Sold by
Hsieh Rosemarie H
Bought by
Pierson Stewart
Home Financials for this Owner
Home Financials are based on the most recent Mortgage that was taken out on this home.
Original Mortgage
$169,600
Interest Rate
7.61%
Mortgage Type
Purchase Money Mortgage
Purchase Details
Closed on
Jun 30, 1998
Sold by
Cardillo Janet L
Bought by
Hsieh Rosemarie A
Create a Home Valuation Report for This Property
The Home Valuation Report is an in-depth analysis detailing your home's value as well as a comparison with similar homes in the area
Home Values in the Area
Average Home Value in this Area
Purchase History
| Date | Buyer | Sale Price | Title Company |
|---|---|---|---|
| Pierson Ft | -- | None Available | |
| Pierson Ft | -- | None Available | |
| Hsieh Rosemarie A | $150,000 | -- | |
| Pierson Stewart | $212,000 | -- | |
| Hsieh Rosemarie A | $150,000 | -- |
Source: Public Records
Mortgage History
| Date | Status | Borrower | Loan Amount |
|---|---|---|---|
| Previous Owner | Hsieh Rosemarie A | $169,600 | |
| Previous Owner | Hsieh Rosemarie A | $48,000 |
Source: Public Records
Tax History Compared to Growth
Tax History
| Year | Tax Paid | Tax Assessment Tax Assessment Total Assessment is a certain percentage of the fair market value that is determined by local assessors to be the total taxable value of land and additions on the property. | Land | Improvement |
|---|---|---|---|---|
| 2025 | $8,230 | $689,300 | $262,100 | $427,200 |
| 2024 | $8,045 | $645,700 | $234,000 | $411,700 |
| 2023 | $7,701 | $588,300 | $208,900 | $379,400 |
| 2022 | $7,351 | $535,000 | $189,500 | $345,500 |
| 2021 | $7,108 | $505,900 | $182,200 | $323,700 |
| 2020 | $7,127 | $475,800 | $165,600 | $310,200 |
| 2019 | $7,058 | $458,900 | $165,600 | $293,300 |
| 2018 | $6,996 | $428,700 | $159,400 | $269,300 |
| 2017 | $6,833 | $408,900 | $154,700 | $254,200 |
| 2016 | $7,025 | $404,200 | $154,700 | $249,500 |
| 2015 | $7,000 | $392,800 | $154,700 | $238,100 |
Source: Public Records
Map
Nearby Homes