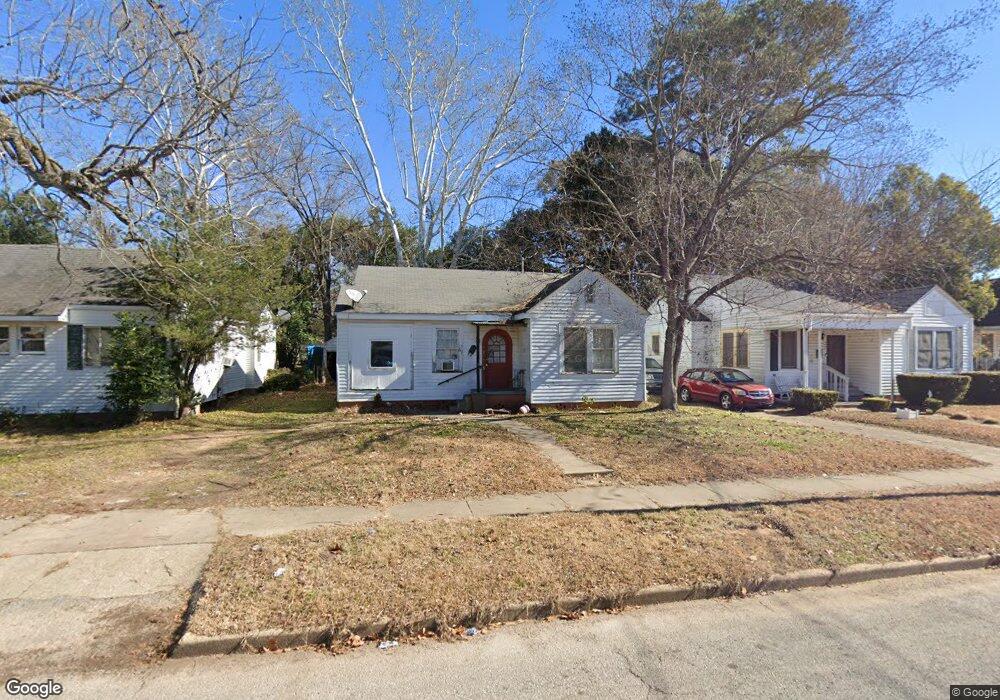
35 Mary St Alexandria, LA 71301
Estimated Value: $39,000 - $77,000
2
Beds
1
Bath
1,015
Sq Ft
$60/Sq Ft
Est. Value
About This Home
This home is located at 35 Mary St, Alexandria, LA 71301 and is currently estimated at $60,493, approximately $59 per square foot. 35 Mary St is a home with nearby schools including Rosenthal Montessori Elementary School, Alexandria Middle Magnet School, and Bolton High School.
Ownership History
Date
Name
Owned For
Owner Type
Purchase Details
Closed on
Dec 20, 2018
Sold by
Southern Heritage Bank
Bought by
Decker Harvey Gene and Decker Barbara Malone
Current Estimated Value
Home Financials for this Owner
Home Financials are based on the most recent Mortgage that was taken out on this home.
Original Mortgage
$50,000,000
Interest Rate
4.9%
Mortgage Type
Unknown
Purchase Details
Closed on
Feb 16, 2006
Sold by
Crumbs R Us Llc
Bought by
Mary Street Properties Llc
Home Financials for this Owner
Home Financials are based on the most recent Mortgage that was taken out on this home.
Original Mortgage
$41,650
Interest Rate
7.95%
Mortgage Type
Credit Line Revolving
Purchase Details
Closed on
May 4, 2005
Sold by
Debarneval Inc
Bought by
Boaz Tax Sale Properties
Create a Home Valuation Report for This Property
The Home Valuation Report is an in-depth analysis detailing your home's value as well as a comparison with similar homes in the area
Home Values in the Area
Average Home Value in this Area
Purchase History
| Date | Buyer | Sale Price | Title Company |
|---|---|---|---|
| Decker Harvey Gene | $58,000 | None Available | |
| Mary Street Properties Llc | $45,000 | None Available | |
| Boaz Tax Sale Properties | $414 | None Available |
Source: Public Records
Mortgage History
| Date | Status | Borrower | Loan Amount |
|---|---|---|---|
| Closed | Decker Harvey Gene | $50,000,000 | |
| Previous Owner | Mary Street Properties Llc | $41,650 |
Source: Public Records
Tax History Compared to Growth
Tax History
| Year | Tax Paid | Tax Assessment Tax Assessment Total Assessment is a certain percentage of the fair market value that is determined by local assessors to be the total taxable value of land and additions on the property. | Land | Improvement |
|---|---|---|---|---|
| 2024 | $73 | $800 | $400 | $400 |
| 2023 | $74 | $800 | $400 | $400 |
| 2022 | $95 | $800 | $400 | $400 |
| 2021 | $81 | $800 | $400 | $400 |
| 2020 | $81 | $800 | $400 | $400 |
| 2019 | $62 | $800 | $400 | $400 |
| 2018 | $385 | $4,500 | $900 | $3,600 |
| 2017 | $387 | $4,500 | $900 | $3,600 |
| 2016 | $500 | $4,500 | $900 | $3,600 |
| 2015 | $498 | $4,500 | $900 | $3,600 |
| 2014 | $500 | $4,500 | $900 | $3,600 |
| 2013 | $479 | $4,500 | $900 | $3,600 |
Source: Public Records
Map
Nearby Homes