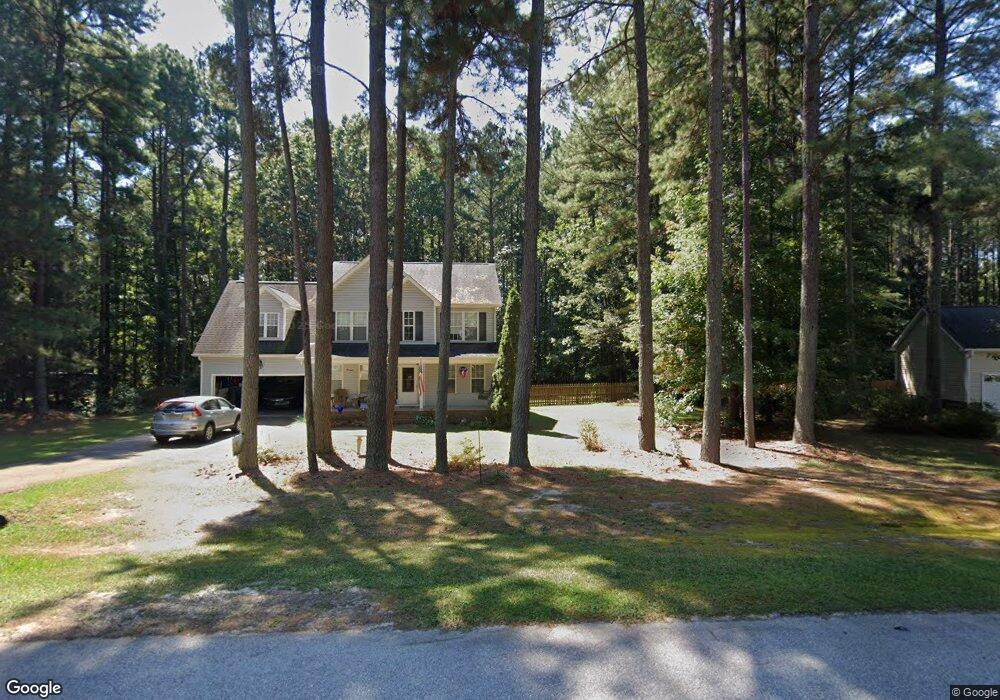
35 Shorrey Place Youngsville, NC 27596
Estimated Value: $415,000 - $444,000
3
Beds
3
Baths
2,310
Sq Ft
$184/Sq Ft
Est. Value
About This Home
This home is located at 35 Shorrey Place, Youngsville, NC 27596 and is currently estimated at $425,005, approximately $183 per square foot. 35 Shorrey Place is a home located in Franklin County with nearby schools including Royal Elementary School, Bunn Middle School, and Bunn High School.
Ownership History
Date
Name
Owned For
Owner Type
Purchase Details
Closed on
Mar 28, 2008
Sold by
Sarver David S and Sarver Dion M
Bought by
Mclaughlin Charles G and Mclaughlin Linda J
Current Estimated Value
Purchase Details
Closed on
Sep 5, 2006
Sold by
Robinson Johnny L and Robinson Susan
Bought by
Sarver David S and Sarver Dioan M
Home Financials for this Owner
Home Financials are based on the most recent Mortgage that was taken out on this home.
Original Mortgage
$25,020,000
Interest Rate
6.67%
Mortgage Type
Purchase Money Mortgage
Purchase Details
Closed on
Dec 1, 2005
Sold by
Maestro Homes Inc
Bought by
Robinson Johnny L and Robinson Susan
Home Financials for this Owner
Home Financials are based on the most recent Mortgage that was taken out on this home.
Original Mortgage
$15,000
Interest Rate
6.04%
Mortgage Type
New Conventional
Purchase Details
Closed on
Jul 27, 2005
Sold by
Zula Belle Land Co Llc
Bought by
Maestro Homes Inc
Home Financials for this Owner
Home Financials are based on the most recent Mortgage that was taken out on this home.
Original Mortgage
$128,000
Interest Rate
5.59%
Mortgage Type
Commercial
Create a Home Valuation Report for This Property
The Home Valuation Report is an in-depth analysis detailing your home's value as well as a comparison with similar homes in the area
Home Values in the Area
Average Home Value in this Area
Purchase History
| Date | Buyer | Sale Price | Title Company |
|---|---|---|---|
| Mclaughlin Charles G | $190,000 | None Available | |
| Sarver David S | $200,000 | None Available | |
| Robinson Johnny L | $201,000 | None Available | |
| Maestro Homes Inc | $150,000 | None Available |
Source: Public Records
Mortgage History
| Date | Status | Borrower | Loan Amount |
|---|---|---|---|
| Previous Owner | Sarver David S | $25,020,000 | |
| Previous Owner | Robinson Johnny L | $15,000 | |
| Previous Owner | Maestro Homes Inc | $128,000 |
Source: Public Records
Tax History Compared to Growth
Tax History
| Year | Tax Paid | Tax Assessment Tax Assessment Total Assessment is a certain percentage of the fair market value that is determined by local assessors to be the total taxable value of land and additions on the property. | Land | Improvement |
|---|---|---|---|---|
| 2025 | $2,344 | $391,970 | $134,400 | $257,570 |
| 2024 | $2,305 | $391,970 | $134,400 | $257,570 |
| 2023 | $2,251 | $249,010 | $36,750 | $212,260 |
| 2022 | $2,241 | $249,010 | $36,750 | $212,260 |
| 2021 | $2,266 | $249,010 | $36,750 | $212,260 |
| 2020 | $2,280 | $249,010 | $36,750 | $212,260 |
| 2019 | $2,248 | $249,010 | $36,750 | $212,260 |
| 2018 | $2,247 | $249,010 | $36,750 | $212,260 |
| 2017 | $1,811 | $180,750 | $35,000 | $145,750 |
| 2016 | $1,874 | $180,750 | $35,000 | $145,750 |
| 2015 | $1,874 | $180,750 | $35,000 | $145,750 |
| 2014 | $1,754 | $180,750 | $35,000 | $145,750 |
Source: Public Records
Map
Nearby Homes
- 10 Shorrey Place
- 3555 Nc 98 Hwy W
- 150 Babbling Creek Dr
- 50 Babbling Creek Dr
- 20 Richmond Place
- 20 Willows Den Ct
- 150 Williamston Ridge Dr
- 85 Old Garden Ln
- 90 Eagle Chase Dr
- 65 Linnett Ct
- 40 Muirfield Dr
- 463 Robbins Rd
- 85 Weathered Oak Way
- 136 Dixie Ln
- 85 Arbor Dr
- 25 Arbor Dr
- 138 Bridle Trail
- 0 Cowboys Trail
- 105 Teal Dr
- 0 S Us 401 Hwy
- 35 W Shorrey Place
- 60 W Shorrey Place
- 45 W Shorrey Place
- 25 W Shorrey Place
- 340 Spencers Gate Dr
- 15 W Shorrey Place
- 55 W Shorrey Place
- 10 W Shorrey Place
- 70 Cricketwood Ln
- 350 Spencers Gate Dr
- 30 Shorrey Place
- 30 Shorrey Place
- 55 Shorrey Place
- 55 Shorrey Place
- 45 Shorrey Place
- 45 Shorrey Place
- 60 Cricketwood Ln
- 15 Spicetree Ct
- 50 Cricketwood Ln
- 10 Shorrey Place