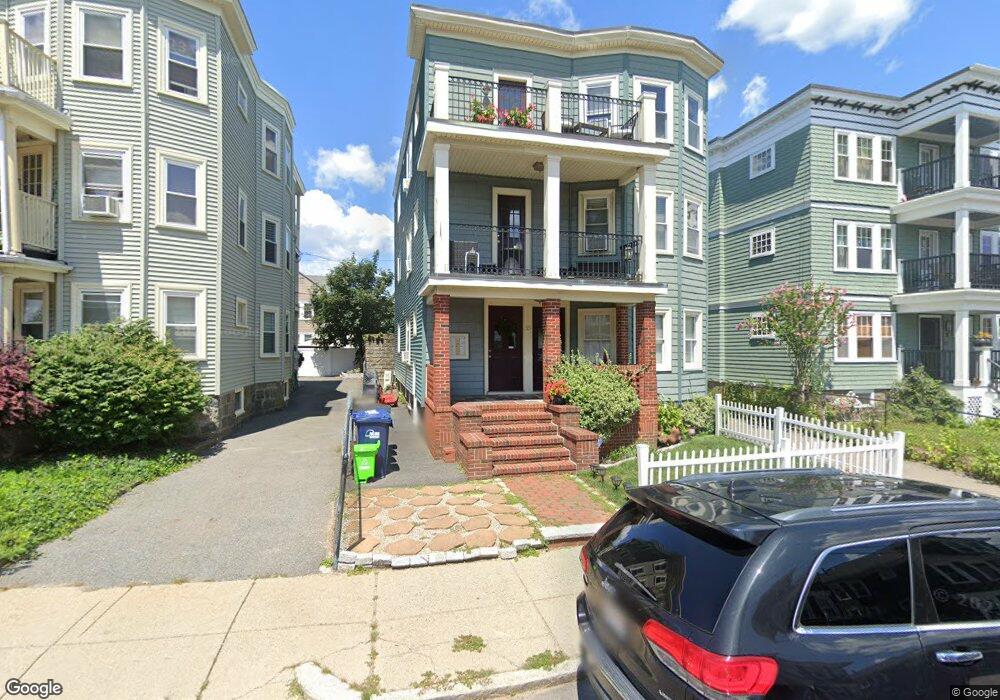
35 South Munroe Terrace Unit 2 Dorchester, MA 02122
Neponset-Port Norfolk NeighborhoodEstimated Value: $510,396 - $556,000
2
Beds
1
Bath
923
Sq Ft
$581/Sq Ft
Est. Value
About This Home
This home is located at 35 South Munroe Terrace Unit 2, Dorchester, MA 02122 and is currently estimated at $535,849, approximately $580 per square foot. 35 South Munroe Terrace Unit 2 is a home located in Suffolk County with nearby schools including Neighborhood House Charter School and Helen Y. Davis Leadership Academy Charter Public School.
Ownership History
Date
Name
Owned For
Owner Type
Purchase Details
Closed on
Jul 15, 2025
Sold by
Rice Molly L and Rice Gregory T
Bought by
Stoker Kelsey D and Stoker Wesley B
Current Estimated Value
Home Financials for this Owner
Home Financials are based on the most recent Mortgage that was taken out on this home.
Original Mortgage
$412,500
Outstanding Balance
$411,106
Interest Rate
6.89%
Mortgage Type
New Conventional
Estimated Equity
$124,743
Purchase Details
Closed on
Oct 15, 2019
Sold by
Nielsen Courtney
Bought by
Maguire Molly L and Rice Gregory T
Purchase Details
Closed on
Aug 19, 2011
Sold by
Bowden Scott T and Bowden Erica M
Bought by
Nielsen Courtney
Purchase Details
Closed on
Feb 26, 2007
Sold by
South Munroe Llc
Bought by
Bowden Erica M and Bowden Scott T
Create a Home Valuation Report for This Property
The Home Valuation Report is an in-depth analysis detailing your home's value as well as a comparison with similar homes in the area
Home Values in the Area
Average Home Value in this Area
Purchase History
| Date | Buyer | Sale Price | Title Company |
|---|---|---|---|
| Stoker Kelsey D | $550,000 | -- | |
| Stoker Kelsey D | $550,000 | -- | |
| Stoker Kelsey D | $550,000 | -- | |
| Stoker Kelsey D | $550,000 | -- | |
| Maguire Molly L | $445,000 | -- | |
| Maguire Molly L | $445,000 | -- | |
| Nielsen Courtney | $228,000 | -- | |
| Nielsen Courtney | $228,000 | -- | |
| Nielsen Courtney | $228,000 | -- | |
| Nielsen Courtney | $228,000 | -- | |
| Nielsen Courtney | $228,000 | -- | |
| Nielsen Courtney | $228,000 | -- | |
| Bowden Erica M | $267,500 | -- | |
| Bowden Erica M | $267,500 | -- | |
| Bowden Erica M | $267,500 | -- | |
| Bowden Erica M | $267,500 | -- | |
| Bowden Erica M | $267,500 | -- | |
| Bowden Erica M | $267,500 | -- |
Source: Public Records
Mortgage History
| Date | Status | Borrower | Loan Amount |
|---|---|---|---|
| Open | Stoker Kelsey D | $412,500 | |
| Closed | Stoker Kelsey D | $412,500 |
Source: Public Records
Tax History Compared to Growth
Tax History
| Year | Tax Paid | Tax Assessment Tax Assessment Total Assessment is a certain percentage of the fair market value that is determined by local assessors to be the total taxable value of land and additions on the property. | Land | Improvement |
|---|---|---|---|---|
| 2025 | $5,395 | $465,900 | $0 | $465,900 |
| 2024 | $5,059 | $464,100 | $0 | $464,100 |
| 2023 | $4,837 | $450,400 | $0 | $450,400 |
| 2022 | $4,623 | $424,900 | $0 | $424,900 |
| 2021 | $4,401 | $412,500 | $0 | $412,500 |
| 2020 | $3,680 | $348,500 | $0 | $348,500 |
| 2019 | $3,463 | $328,600 | $0 | $328,600 |
| 2018 | $3,190 | $304,400 | $0 | $304,400 |
| 2017 | $2,958 | $279,300 | $0 | $279,300 |
| 2016 | $2,871 | $261,000 | $0 | $261,000 |
| 2015 | $2,892 | $238,800 | $0 | $238,800 |
| 2014 | $2,756 | $219,100 | $0 | $219,100 |
Source: Public Records
Map
Nearby Homes
- 3 N Munroe Terrace
- 108 King St Unit 3
- 96 King St Unit 1
- 104 King St Unit 2
- 223 Neponset Ave Unit 2
- 6 Agawam St
- 60 Houghton St Unit 62
- 4 Payne St Unit 5
- 543 Adams St Unit 24
- 34 Houghton St
- 36 Mckone St Unit 2
- 36 Mckone St
- 36 Mckone St Unit 1
- 56 Coffey St Unit 10
- 41 King St Unit 1
- 8 Mckone St
- 381 Adams St Unit 2
- 381 Adams St Unit 1
- 381 Adams St Unit 3
- 51 Coffey St Unit 51C
- 35 South Munroe Terrace Unit 3
- 35 South Munroe Terrace Unit 1
- 35 S Munroe Terrace Unit 2
- 35 S Munroe Terrace Unit 1
- 35 S Munroe Terrace Unit 3
- 37 South Munroe Terrace Unit 3
- 37 South Munroe Terrace Unit 2
- 37 South Munroe Terrace Unit 1
- 37 S Munroe Terrace
- 37 S Munroe Terrace Unit 2
- 37 S Munroe Terrace Unit 1
- 33 South Munroe Terrace
- 39 S Munroe Terrace Unit A
- 39 S Munroe Terrace Unit C
- 39 South Munroe Terrace Unit C
- 39 South Munroe Terrace Unit B
- 39 South Munroe Terrace Unit A
- 39 S Munroe Terrace Unit B
- 39 S Munroe Terrace Unit 1
- 39 S Munroe Terrace Unit 2