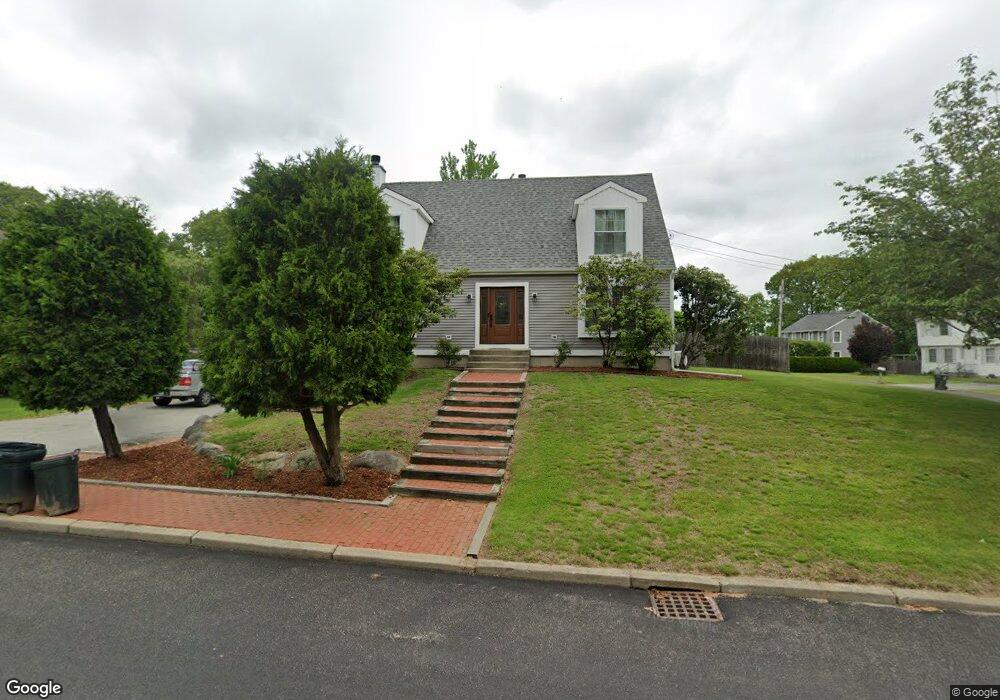
35 Traymore St Cranston, RI 02920
Thornton NeighborhoodEstimated Value: $512,000 - $642,000
3
Beds
2
Baths
1,820
Sq Ft
$322/Sq Ft
Est. Value
About This Home
This home is located at 35 Traymore St, Cranston, RI 02920 and is currently estimated at $586,722, approximately $322 per square foot. 35 Traymore St is a home located in Providence County with nearby schools including Stone Hill School, Western Hills Middle School, and Cranston High School West.
Ownership History
Date
Name
Owned For
Owner Type
Purchase Details
Closed on
Jan 10, 2019
Sold by
Mercurio John L
Bought by
Ditraglia Sabrina
Current Estimated Value
Purchase Details
Closed on
Jun 2, 2011
Sold by
Mercurio John L and Mercurio Diana G
Bought by
Mercurio John L
Create a Home Valuation Report for This Property
The Home Valuation Report is an in-depth analysis detailing your home's value as well as a comparison with similar homes in the area
Home Values in the Area
Average Home Value in this Area
Purchase History
| Date | Buyer | Sale Price | Title Company |
|---|---|---|---|
| Ditraglia Sabrina | $229,000 | -- | |
| Mercurio John L | -- | -- |
Source: Public Records
Mortgage History
| Date | Status | Borrower | Loan Amount |
|---|---|---|---|
| Previous Owner | Mercurio John L | $169,995 | |
| Previous Owner | Mercurio John L | $27,000 | |
| Previous Owner | Mercurio John L | $35,000 |
Source: Public Records
Tax History Compared to Growth
Tax History
| Year | Tax Paid | Tax Assessment Tax Assessment Total Assessment is a certain percentage of the fair market value that is determined by local assessors to be the total taxable value of land and additions on the property. | Land | Improvement |
|---|---|---|---|---|
| 2025 | $6,869 | $494,900 | $160,900 | $334,000 |
| 2024 | $6,736 | $494,900 | $160,900 | $334,000 |
| 2023 | $6,675 | $353,200 | $115,100 | $238,100 |
| 2022 | $6,538 | $353,200 | $115,100 | $238,100 |
| 2021 | $6,358 | $353,200 | $115,100 | $238,100 |
| 2020 | $6,019 | $289,800 | $115,100 | $174,700 |
| 2019 | $6,019 | $289,800 | $115,100 | $174,700 |
| 2018 | $5,880 | $289,800 | $115,100 | $174,700 |
| 2017 | $5,313 | $231,600 | $98,600 | $133,000 |
| 2016 | $5,199 | $231,600 | $98,600 | $133,000 |
| 2015 | $5,199 | $231,600 | $98,600 | $133,000 |
| 2014 | $5,029 | $220,200 | $94,500 | $125,700 |
Source: Public Records
Map
Nearby Homes